| Date | Open | High | Low | Close | Change | %Change | Volume | Note |
|---|---|---|---|---|---|---|---|---|
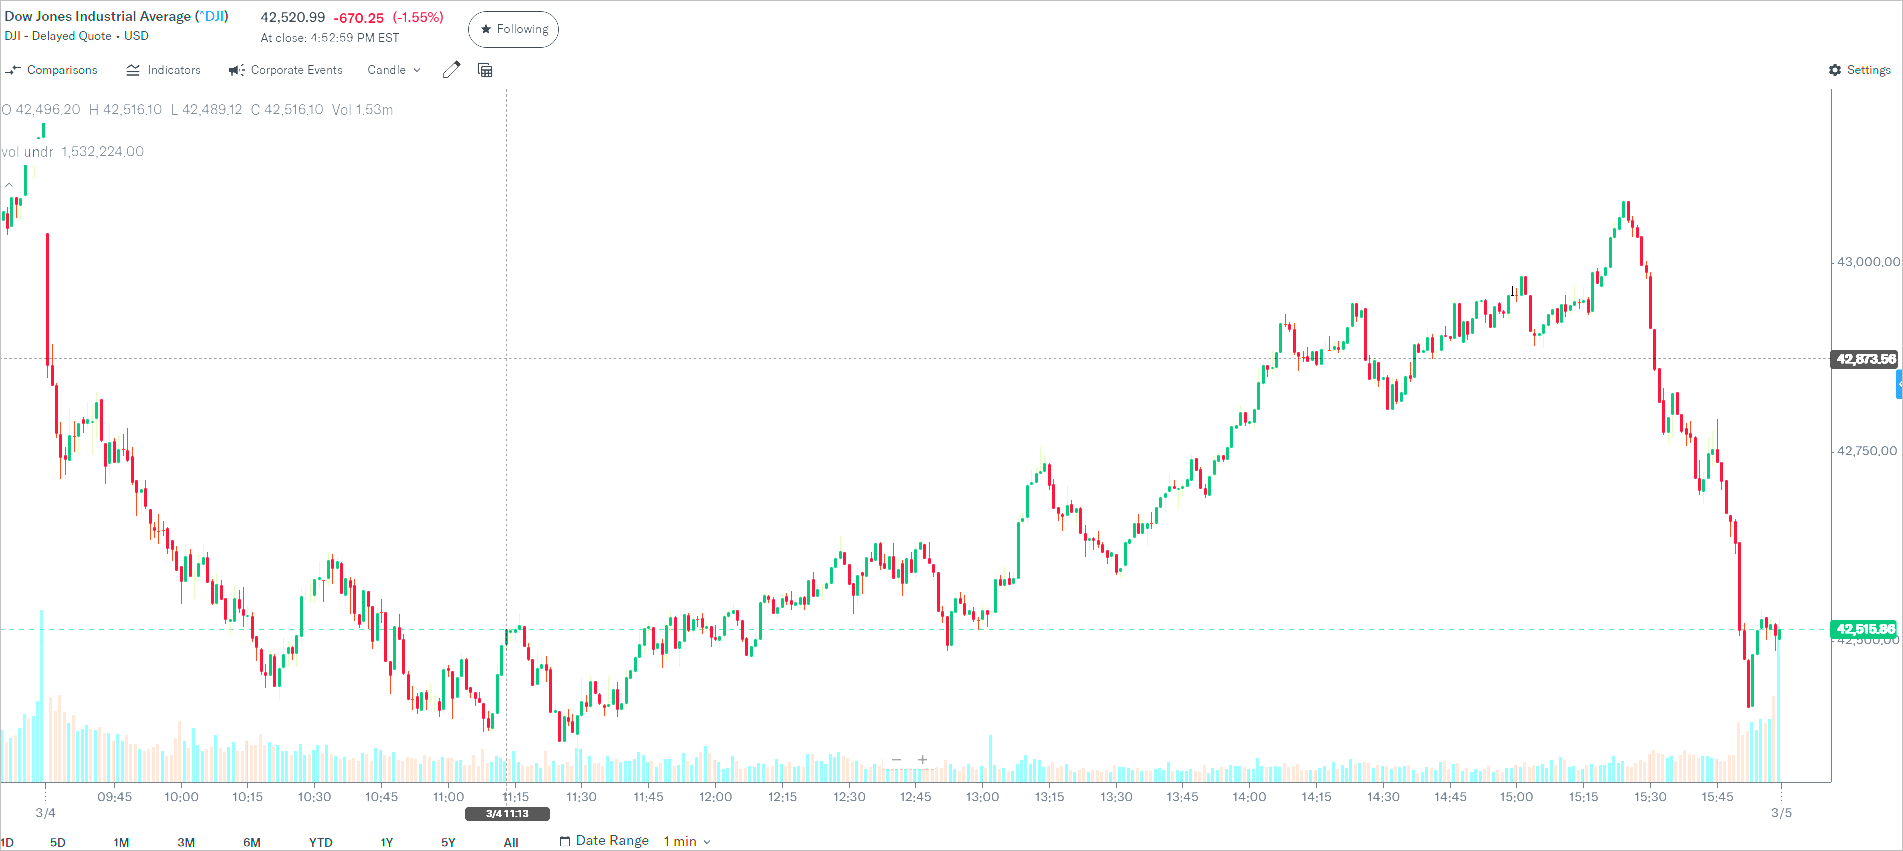
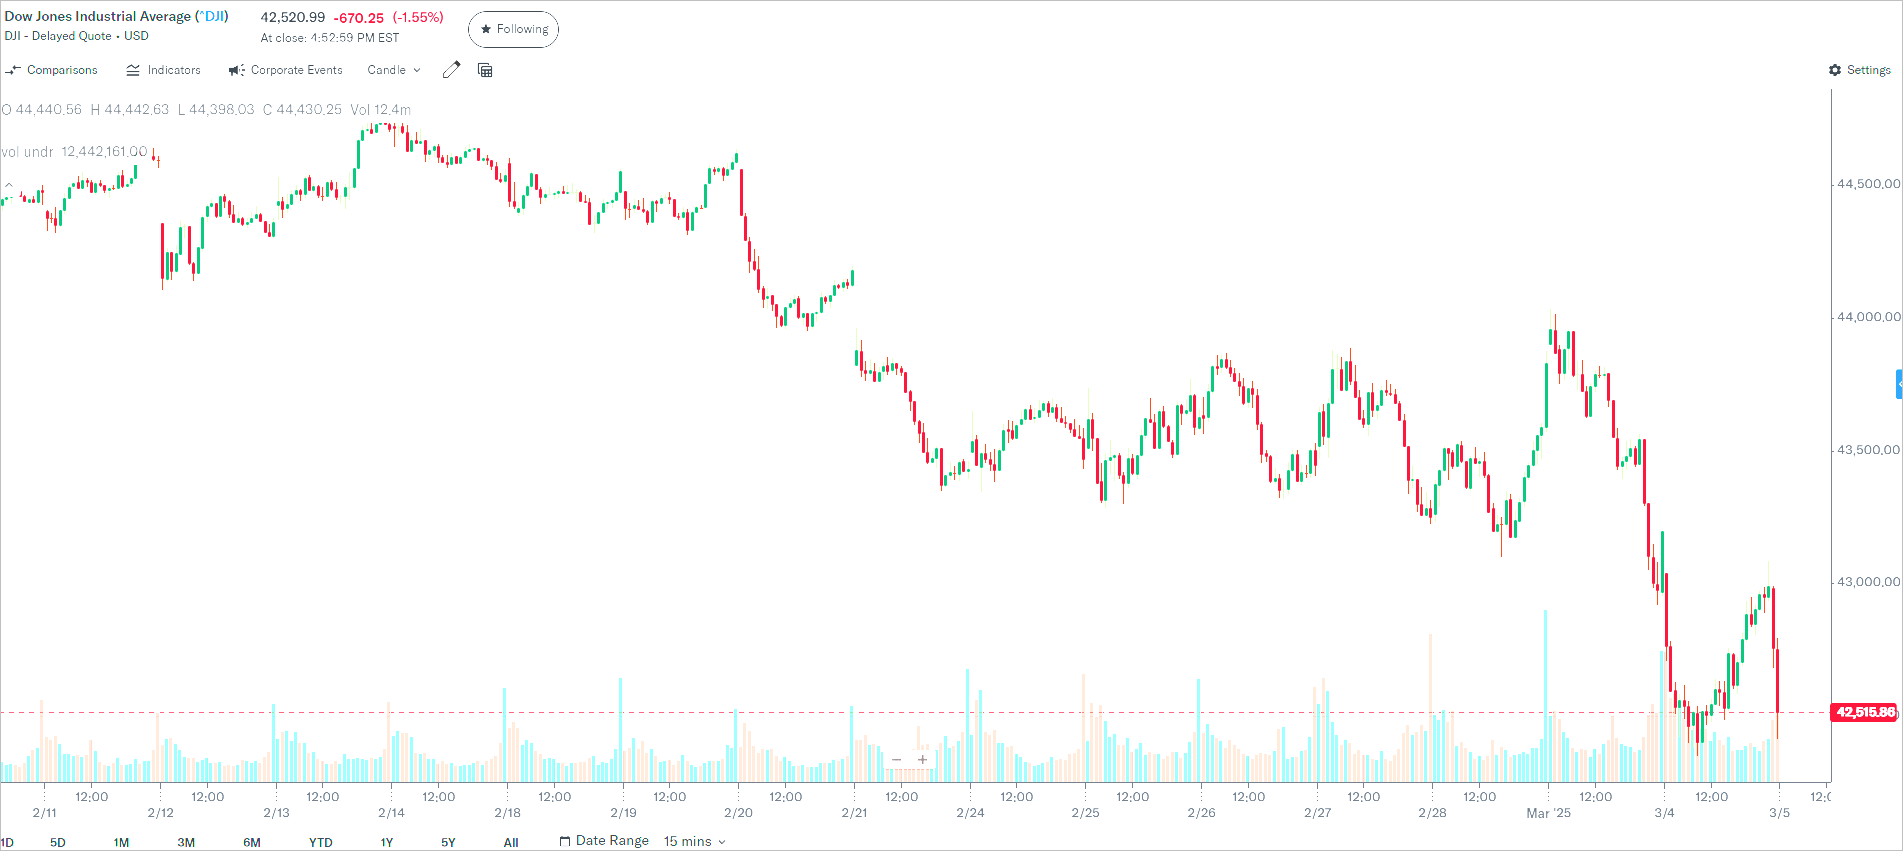
| 2025.03.04 | 43,040.30 | 43,084.00 | 42,347.75 | 42,520.992 | -670.25 | -1.55% | 558,028,103 | |
| 2025.02.21 | 43,820.13 | 43,959.73 | 43,349.33 | 43,428.02 | -748.58 | -1.69% | 622,550,000 | |
| 2024.11.29 | 44,760.05 | 45,071.29 | 44,760.05 | 44,910.65 | +188.59 | +0.42% | 319,210,000 | |
| 2024.11.15 | 43,587.90 | 43,647.53 | 43,350.43 | 43,444.99 | -305.87 | -0.70% | 371,286,093 | |
| 2024.11.08 | 43,768.50 | 44,157.29 | 43,733.86 | 43,988.99 | +259.69 | +0.59% | 357,560,156 | |
| 2024.07.15 | 40,138.40 | 40,351.10 | 40,136.10 | 40,211.78 | +210.88 | +0.53% | 354,752,295 | |
| 2024.05.30 | 38,368.35 | 38,493.60 | 38,000.96 | 38,111.48 | -330.06 | -0.86% | 360,085,312 | |
| 2024.05.20 | 39,989.76 | 40,077.40 | 39,787.09 | 39,806.77 | -196.82 | -0.49% | 272,450,496 | |
| 2024.05.01 | 37,845.60 | 38,349.20 | 37,780.54 | 37,903.29 | +87.37 | +0.23% | 343,952,459 | |
| 2024.04.26 | 38,114.70 | 38,337.64 | 38,065.05 | 38,239.66 | +153.86 | +0.40% | 342,907,777 | |
| 2024.04.18 | 37,847.20 | 38,083.76 | 37,681.52 | 37,775.38 | +22.07 | +0.06% | 300,207,488 | HH HL |
| 2024.04.17 | 37,949.70 | 38,036.70 | 37,611.56 | 37,753.31 | -45.66 | -0.12% | 342,914,516 | Lower Low |
| 2024.04.04 | 39,343.60 | 39,421.35 | 38,559.42 | 38,596.98 | -530.16 | -1.35% | 356,514,263 | |
| 2024.03.11 | 38,667.21 | 38,794.76 | 38,483.25 | 38,769.66 | +46.97 | +0.12% | 328,256,000 | Bitcoin ATH 72,738.19 |
| 2024.02.23 | 39,127.97 | 39,282.28 | 39,094.36 | 39,131.53 | +62.42 | +0.16% | 321,555,573 | ATH 39,282.28 |
| 2023.12.15 | 37,194.50 | 37,347.60 | 37,092.02 | 37,305.16 | +56.81 | +0.15% | 788,163,554 | |
| 2023.12.14 | 37,115.63 | 37,287.50 | 37,051.52 | 37,248.35 | +158.11 | +0.43% | 455,407,616 | |
| 2023.12.13 | 36,601.80 | 37,094.85 | 36,523.59 | 37,090.24 | +512.30 | +1.40% | 354,820,589 | |
| 2023.06.02 | 33,187.58 | 33,805.00 | 33,187.58 | 33,762.76 | +701.19 | -2.12% | 389,257,005 | |
| 2023.03.10 | 32,185.14 | 32,422.10 | 31,783.41 | 31,909.64 | -345.22 | -1.07% | 400,242,395 | |
| 2023.03.09 | 32,876.83 | 32,990.46 | 32,190.60 | 32,254.86 | -543.54 | -1.66% | 318,637,620 | |
| 2023.03.07 | 33,428.31 | 33,453.25 | 32,838.21 | 32,856.46 | -574.98 | -1.72% | 301,592,850 | |
| 2023.03.03 | 33,076.33 | 33,405.82 | 33,008.41 | 33,390.97 | +387.40 | +1.17% | 302,946,201 | |
| 2023.01.31 | 33,803.56 | 33,959.82 | 33,664.91 | 33,934.78 | +217.69 | +0.65% | 207,568,433 | |
| 2023.01.20 | 33,073.46 | 33,381.95 | 32,948.93 | 33,375.49 | +330.93 | +1.00% | 369,420,618 | |
| 2023.01.06 | 33,055.30 | 33,710.66 | 32,997.39 | 33,630.61 | +700.53 | +2.13% | 365,497,603 | |
| 2022.12.15 | 33,773.00 | 33,773.00 | 33,016.16 | 33,202.22 | -764.13 | -2.25% | 394,295,009 | |
| 2022.11.30 | 33,795.43 | 34,589.77 | 33,583.77 | 34,589.77 | +737.24 | +2.18% | 552,485,258 | |
| 2022.11.02 | 32,576.28 | 33,071.93 | 32,139.77 | 32,147.76 | -505.44 | -1.55% | 399,646,339 | |
| 2022.10.28 | 32,204.31 | 32,889.81 | 32,158.38 | 32,861.80 | +828.52 | +2.59% | 499,424,240 | |
| 2022.10.14 | 30,192.21 | 30,428.82 | 29,614.30 | 29,634.83 | -403.89 | -1.34% | 380,975,687 | |
| 2022.10.13 | 28,755.83 | 30,168.54 | 28,660.94 | 30,038.72 | +827.87 | +2.83% | 472,674,793 | |
| 2022.10.07 | 29,685.27 | 29,685.27 | 29,142.66 | 29,296.79 | -630.15 | -2.11% | 370,384,712 | |
| 2022.10.04 | 29,826.67 | 30,325.05 | 29,826.67 | 30,316.32 | +825.43 | +2.80% | 379,032,263 | |
| 2022.10.03 | 28,855.25 | 29,647.79 | 28,855.25 | 29,490.89 | +765.38 | +2.66% | 400,221,908 | |
| 2022.09.30 | 29,123.03 | 29,355.78 | 28,715.85 | 28,725.51 | -500.10 | -1.71% | 466,861,225 | |
| 2022.09.23 | 29,955.65 | 29,955.65 | 29,250.47 | 29,590.41 | -486.27 | -1.62% | 389,446,456 | |
| 2022.09.13 | 32,006.50 | 32,006.50 | 31,080.54 | 31,104.97 | -1,276.37 | -3.94% | 433,796,382 | |
| 2022.09.09 | 31,876.22 | 32,227.74 | 31,876.22 | 32,151.71 | +377.19 | +1.19% | 312,398,267 | |
| 2022.08.26 | 33,293.43 | 33,364.70 | 32,278.22 | 32,283.40 | -1,008.38 | -3.03% | 352,849,368 | |
| 2022.08.22 | 33,586.59 | 33,586.59 | 33,007.63 | 33,063.61 | -643.13 | -1.91% | 308,895,170 | |
| 2022.08.12 | 33,430.72 | 33,767.09 | 33,398.32 | 33,761.05 | +424.38 | +1.27% | 301,160,646 | |
| 2022.08.02 | 32,691.29 | 32,772.93 | 32,387.12 | 32,396.17 | -402.23 | -1.23% | 320,392,142 | |
| 2022.07.29 | 32,515.62 | 32,910.18 | 32,493.02 | 32,845.13 | +315.50 | +0.97% | 490,272,653 | |
| 2022.07.19 | 31,165.91 | 31,842.25 | 31,165.91 | 31,827.05 | +754.44 | +2.43% | 379,947,231 | |
| 2022.07.15 | 30,775.37 | 31,288.26 | 30,775.37 | 31,288.26 | +658.09 | +2.15% | 337,387,940 | |
| 2022.06.13 | 31,144.91 | 31,144.91 | 30,373.72 | 30,516.74 | -876.05 | -2.79% | 472,290,715 | |
| 2022.06.10 | 32,053.52 | 32,053.52 | 31,387.84 | 31,392.79 | -880.00 | -2.73% | 364,806,207 | |
| 2022.05.05 | 33,854.17 | 33,854.17 | 32,685.10 | 32,997.97 | -1,063.09 | -3.12% | 448,418,904 | |
| 2022.04.29 | 33,787.01 | 33,919.59 | 32,913.15 | 32,977.21 | -939.18 | -2.77% | 501,563,555 | |
| 2022.04.26 | 33,907.49 | 33,909.51 | 33,230.95 | 33,240.18 | -809.28 | -2.38% | 403,703,232 | |
| 2022.04.22 | 34,727.38 | 34,727.38 | 33,773.39 | 33,811.40 | -981.36 | -2.82% | 379,807,789 | |
| 2022.04.19 | 34,394.62 | 34,983.11 | 34,394.62 | 34,911.20 | +0.00 | +0.00% | ||
| 2022.02.24 | 32,830.33 | 33,269.34 | 32,272.64 | 33,223.83 | +92.07 | +0.28% | ||
| 2021.12.23 | 35,782.42 | 36,060.99 | 35,782.42 | 35,950.56 | +196.67 | +0.55% | 250,941,712 |
ชันสูตรสิ้นวัน
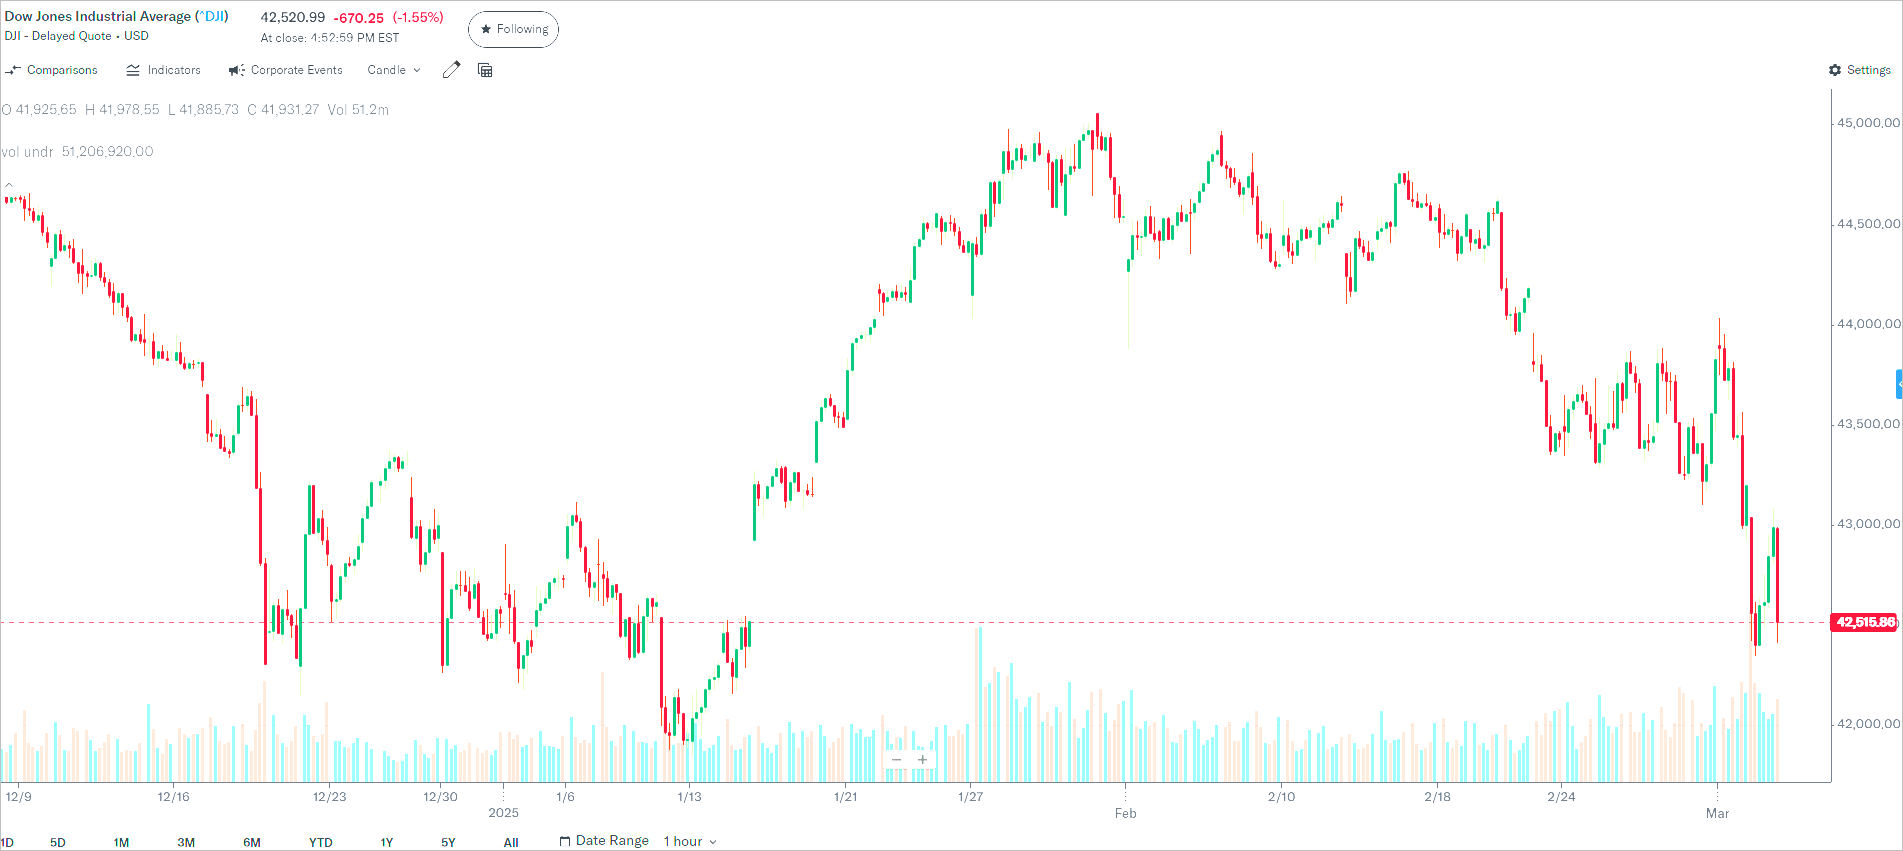
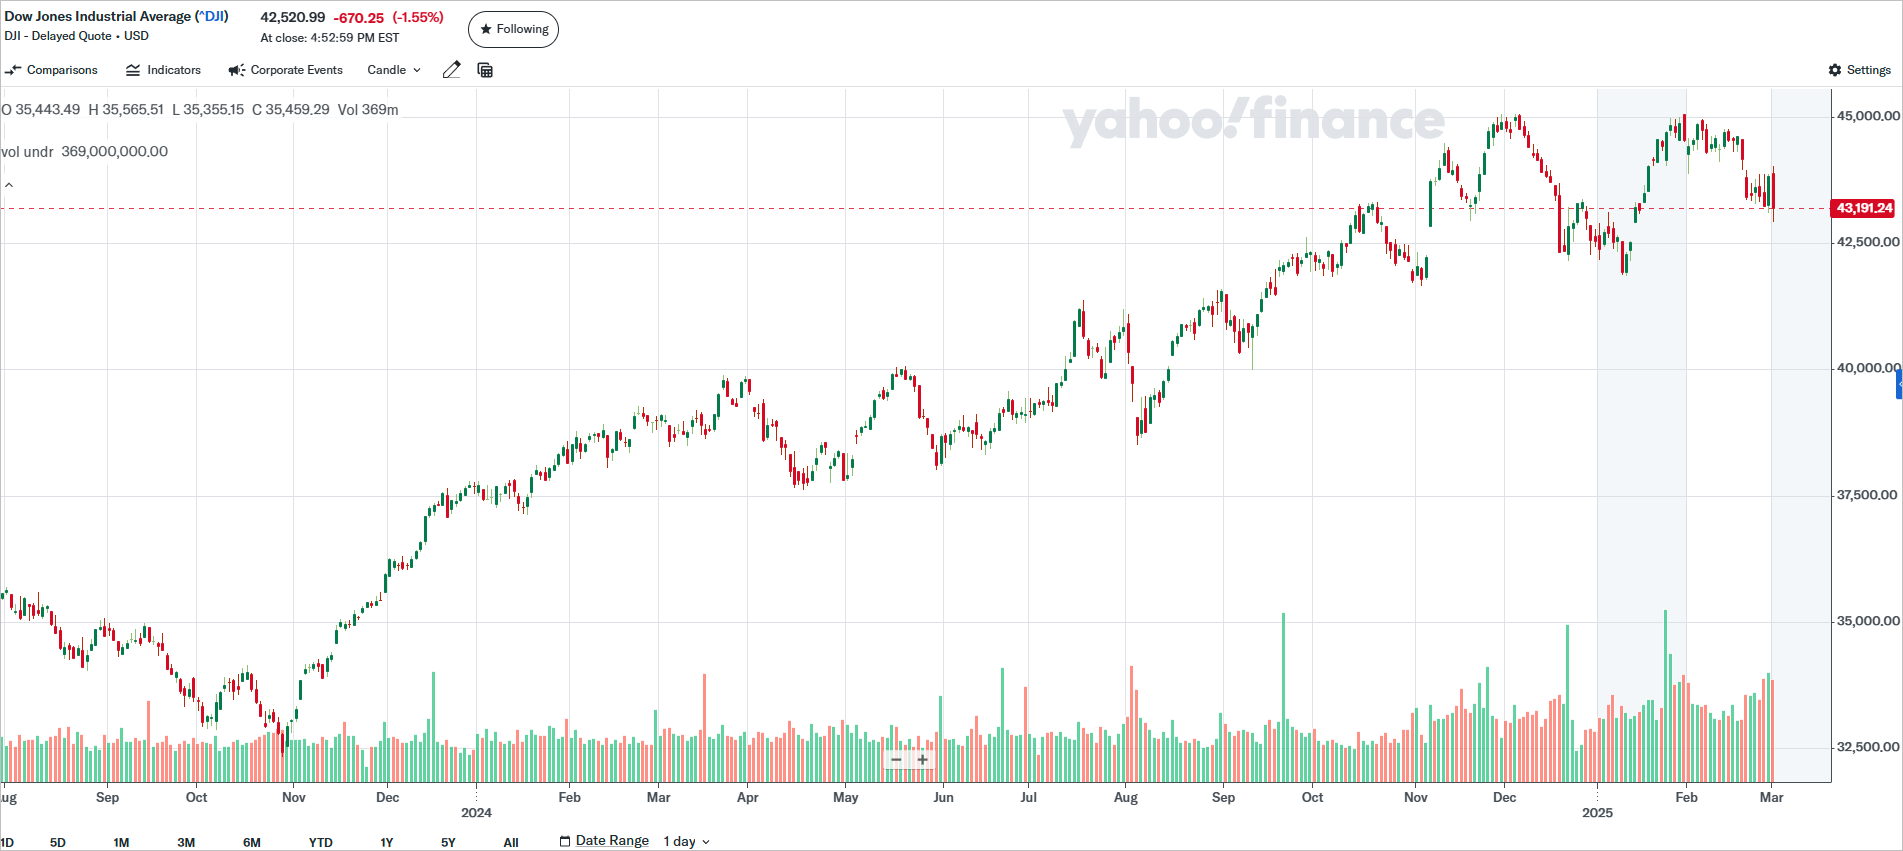
Trump tariff war wipes out Wall Street’s post-election gains
Wall Street’s flagship stock market has lost all its gains since the election of Donald Trump in November after the US imposed tariffs on its closest allies and China.
The Dow plunges almost 700 points because now Trump’s trade war is real
U.S. stocks plummeted again on Tuesday, with the Dow Jones Industrial Average dropping 670 points as President Donald Trump’s newly imposed 25% tariffs on goods from Canada, Mexico, and China prompted retaliatory measures from some of the affected countries.
China imposed additional duties of up to 15% on certain U.S. products. Ottawa retaliated with 25% tariffs on $30 billion worth of U.S. goods starting Tuesday, rising to cover $125 billion of merchandise in 21 days. Canada’s provinces are taking their own actions, and irate citizens are boycotting U.S. products.
As the day ended in New York, the Nasdaq Composite dipped by 0.3%, while the Dow Jones Industrial Average shed 670 points or 1.5%. The S&P 500, which had its worst day of the year on Monday, dropped 1.2%.