Source: 📈 Yahoo! Finance with Python and Pandas

For data science, Yahoo Finance is an ideal resource for quick, up-to-the-minute financial data, and it is not just for stocks. There is a wealth of information available through the API, including extensive company data, covering not only traded companies but also currency exchange, cryptocurrency, mutual funds, and treasury yields. And with the convenient and fairly well-maintained yfinance module available for Python, few sources are easier to work with than Yahoo Finance.
In this article, I will walk through the basic to the advanced and give an overview of the most powerful functionality of this very useful API. For the full code included here, you can view the Jupyter , HTML , and PDF versions. You can also look over helpers.py, which contains many helper functions that I use extensively throughout this project to streamline the delivery of data and create a more visually appealing experience.
● Other Links: Yahoo Finance |
yfinance module ●
● To view the helpers.py file that I use in this project, please click here for GitHub. ●
Special thanks to Alexander Hagmann for his thorough instruction.


One of the most beneficial aspects of Yahoo Finance is how quick and easy it is to access data. There is no API key needed, and the yfinance module can return an incredible wealth of data with just one line of code.
To dive right in, after importing yfinance as yf, we will create a ticker variable for “GE” and pass it to yf.download(). By default, if we only pass the ticker name, we receive the data for every trading day in the history of the company, which as you can see below for GE, dates back to January 2, 1962. So with yf.download() and a ticker symbol alone, it is possible to get a great deal of data.
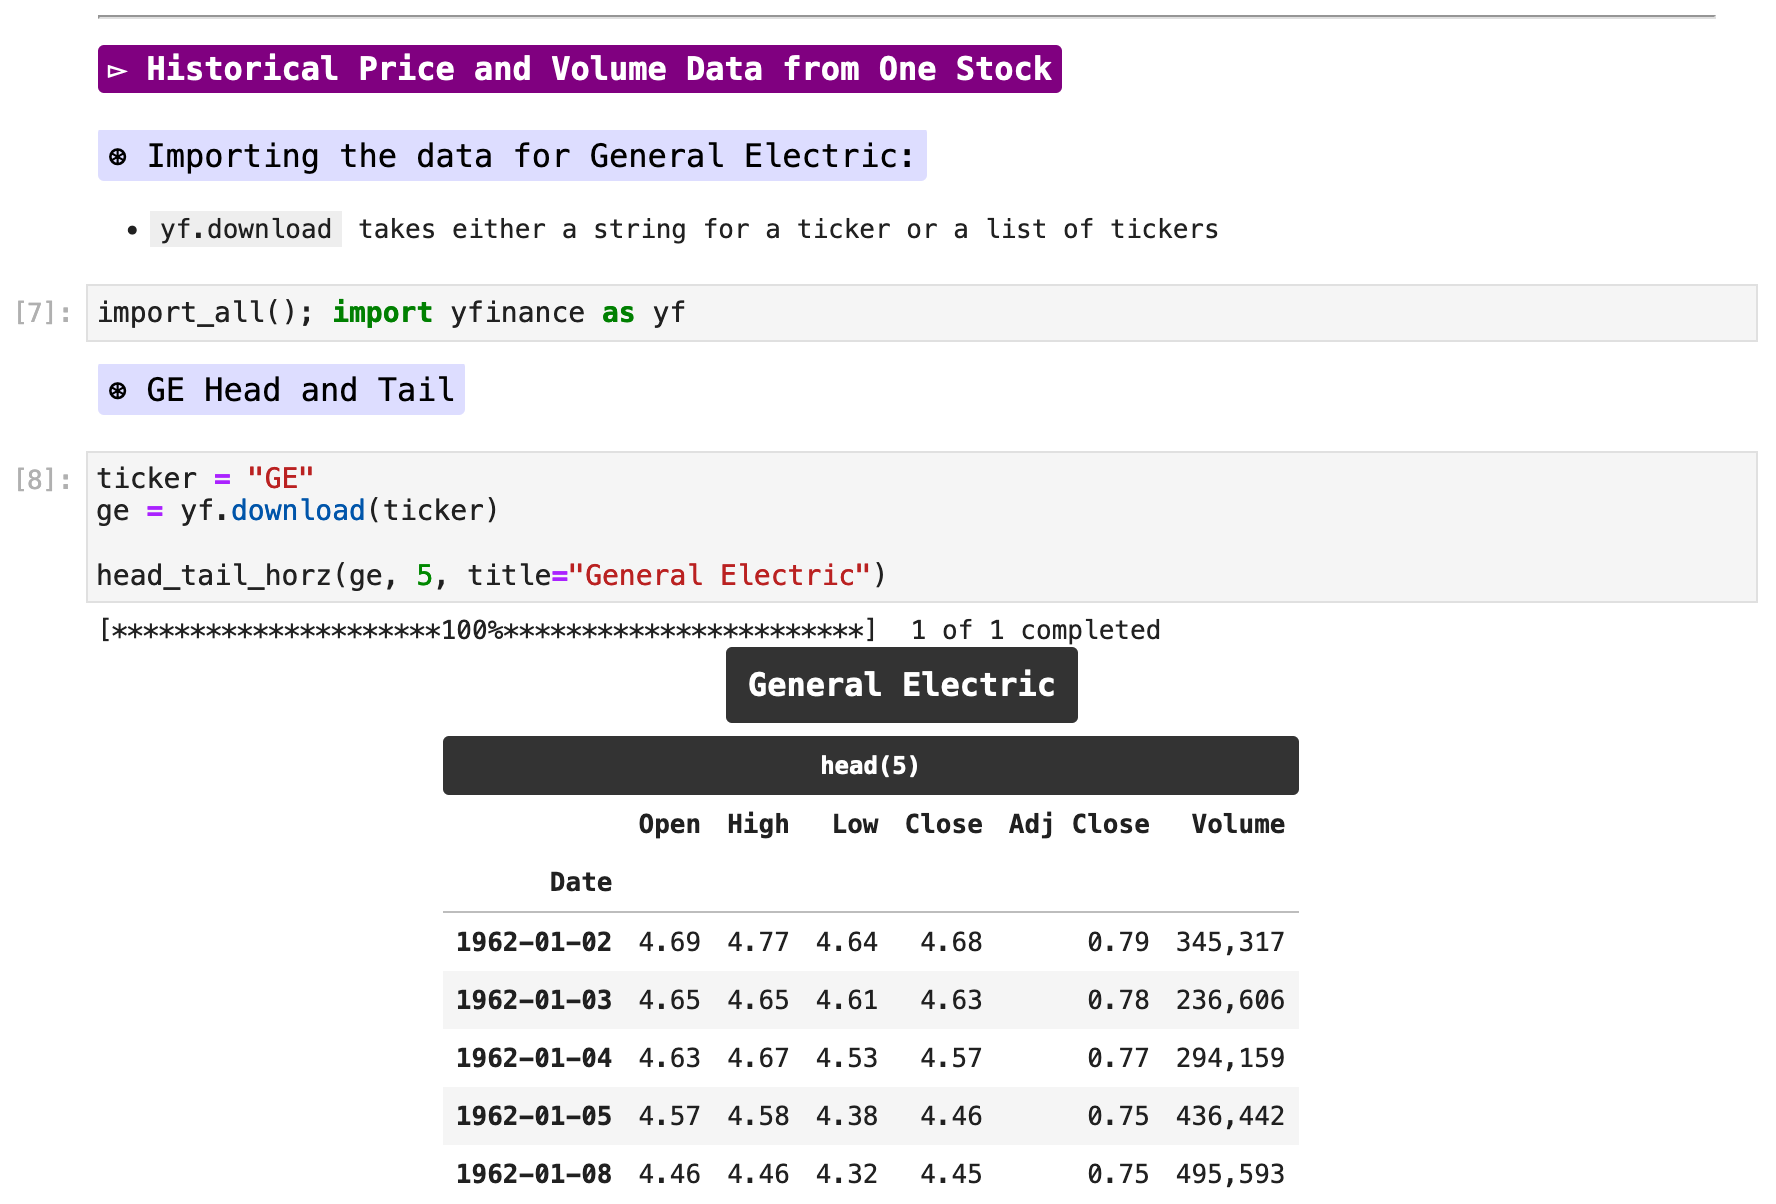

The following is the code for head_tail_vert() and head_tail_horz(), which I use with dataframes extensively to present more easily digestible, labeled data.
Plotting the last 60+ years of stock fluctuations for GE reveals some soaring prices and some unfortunate declines as well.
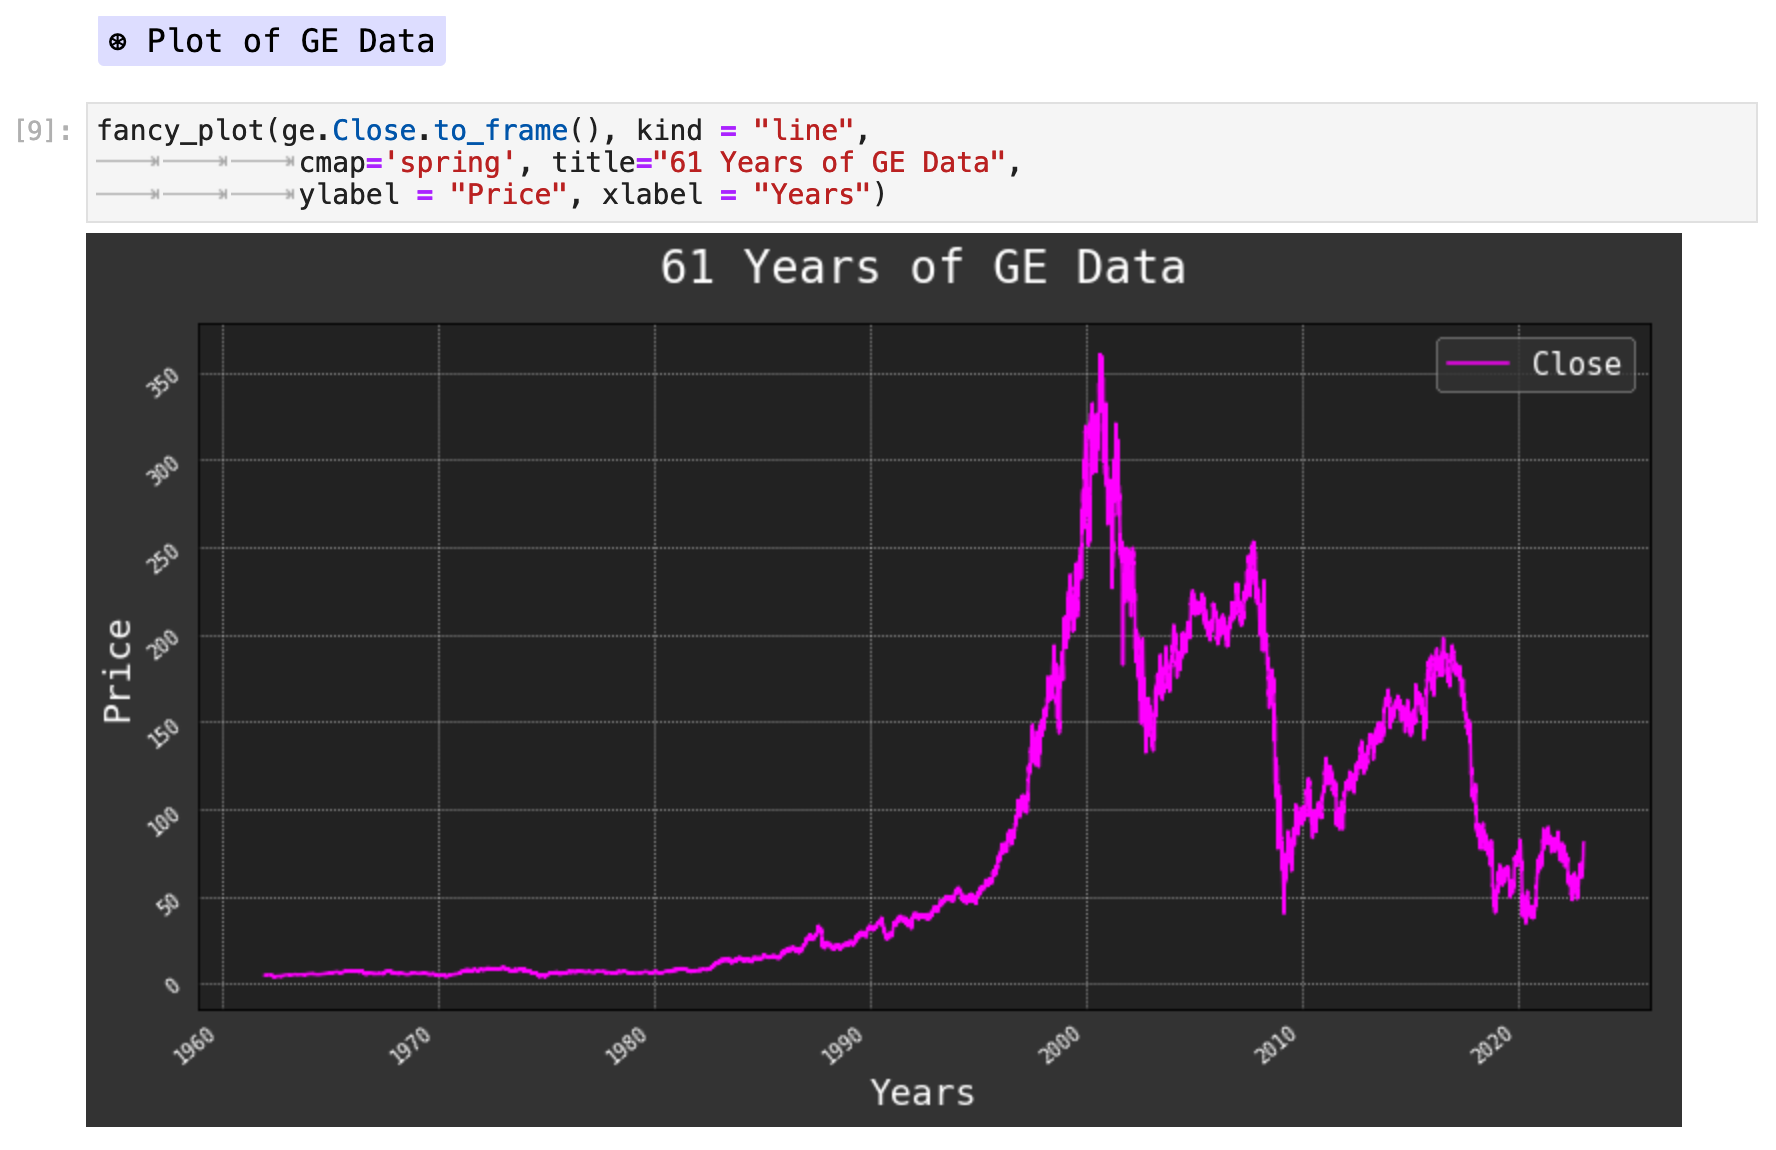
The following is the code for fancy_plot(), which I use for many of my visualizations. It is a highly customized wrapper, centered on the pandas .plot() method.

Sections: ● Top ● Historical Data ● Setting Date Range ● High Frenquency ● Splits & Dividends ● Exporting ● Multiple Stocks ● Importing Indexes ● Currency Exchange ● Cryptocurrencies ● Mutual & Exchange Traded Funds ● Treasury Yields ● Ticker Object & Docs ● Stock Fundamentals ● Importing Financials ● Importing Put & Call Options ● Streaming Real-Time ●

Often times we do not want the entire stock exchange history for a ticker symbol, but rather a date range. There are a few ways to do this. Here we will look at a some general time periods that can be passed to the yf.download() argument, period.
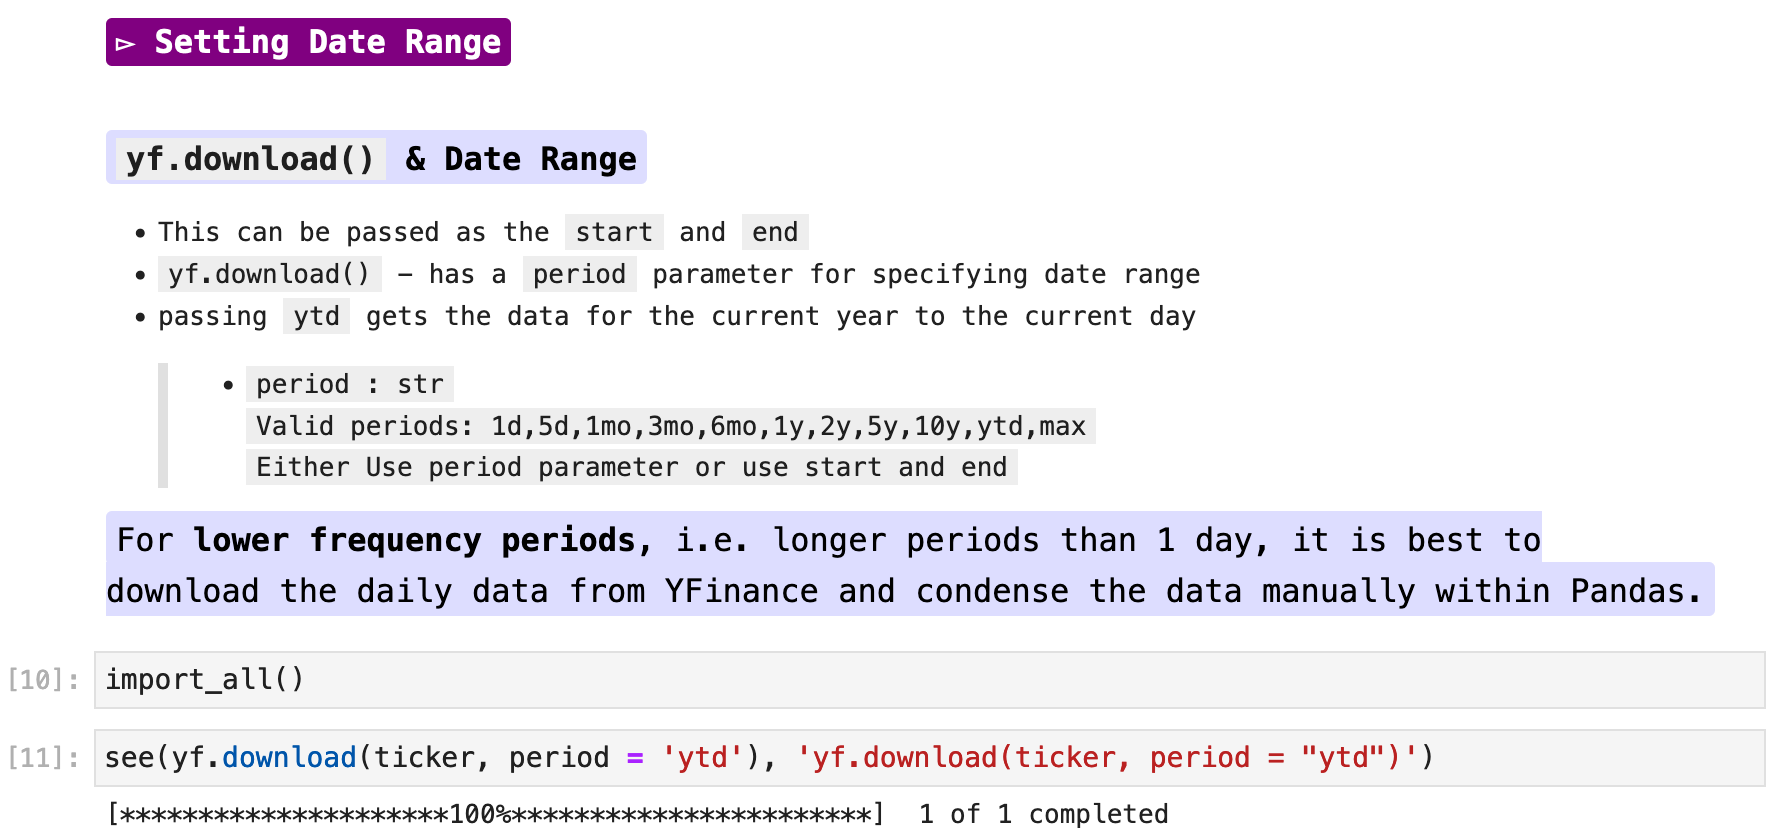
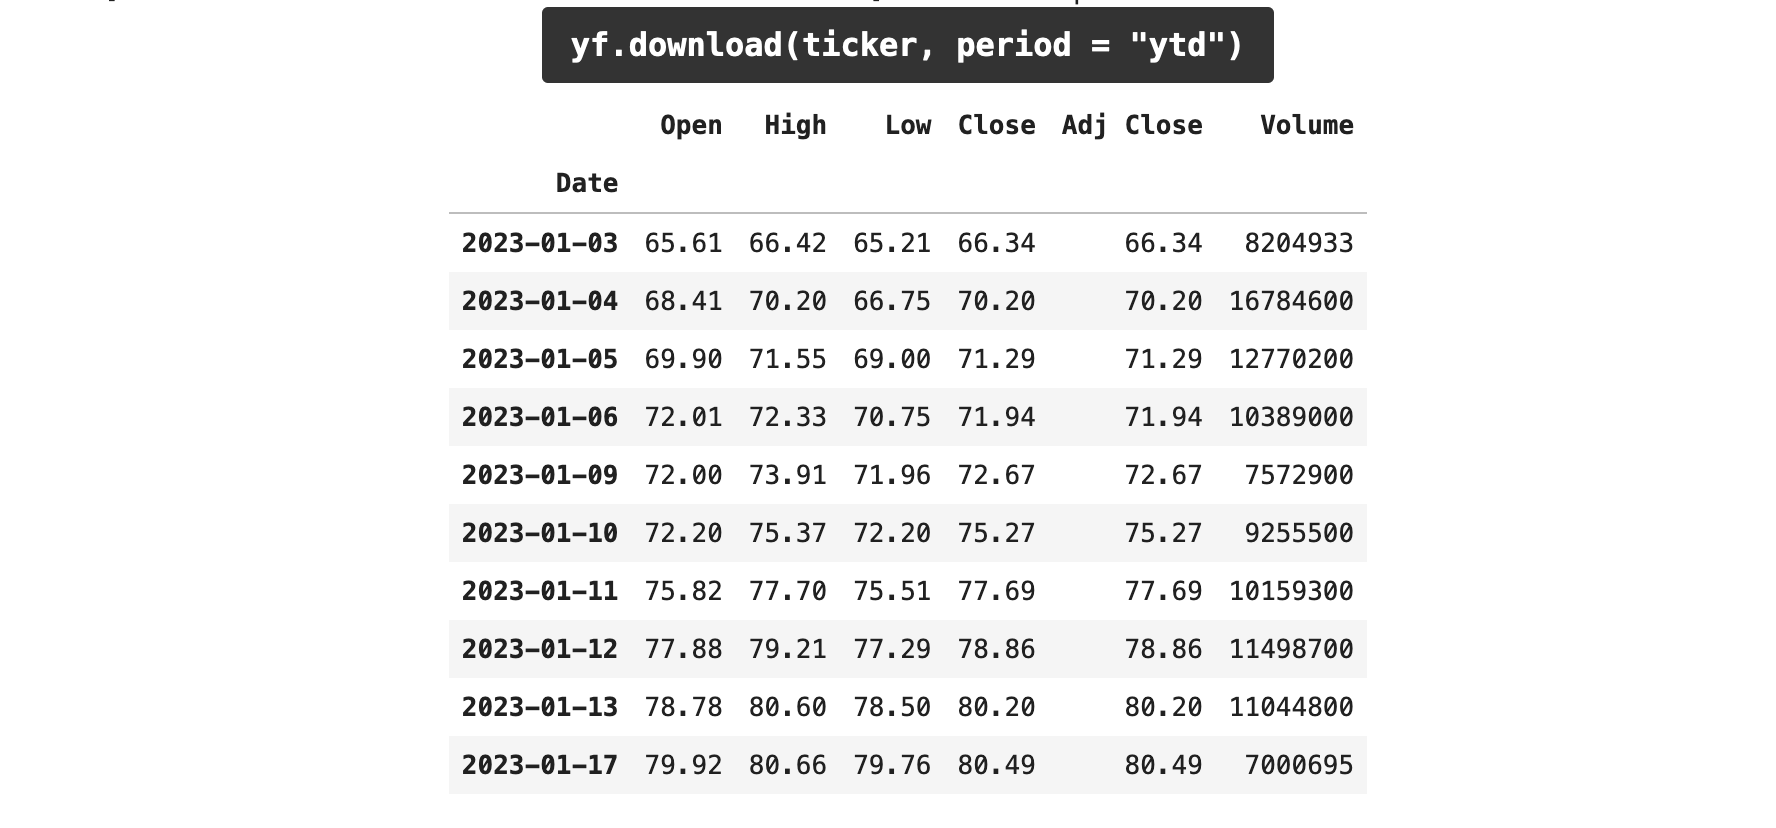
To get all the data from the first day of the year to the current day of the year, we can pass period = "ytd".
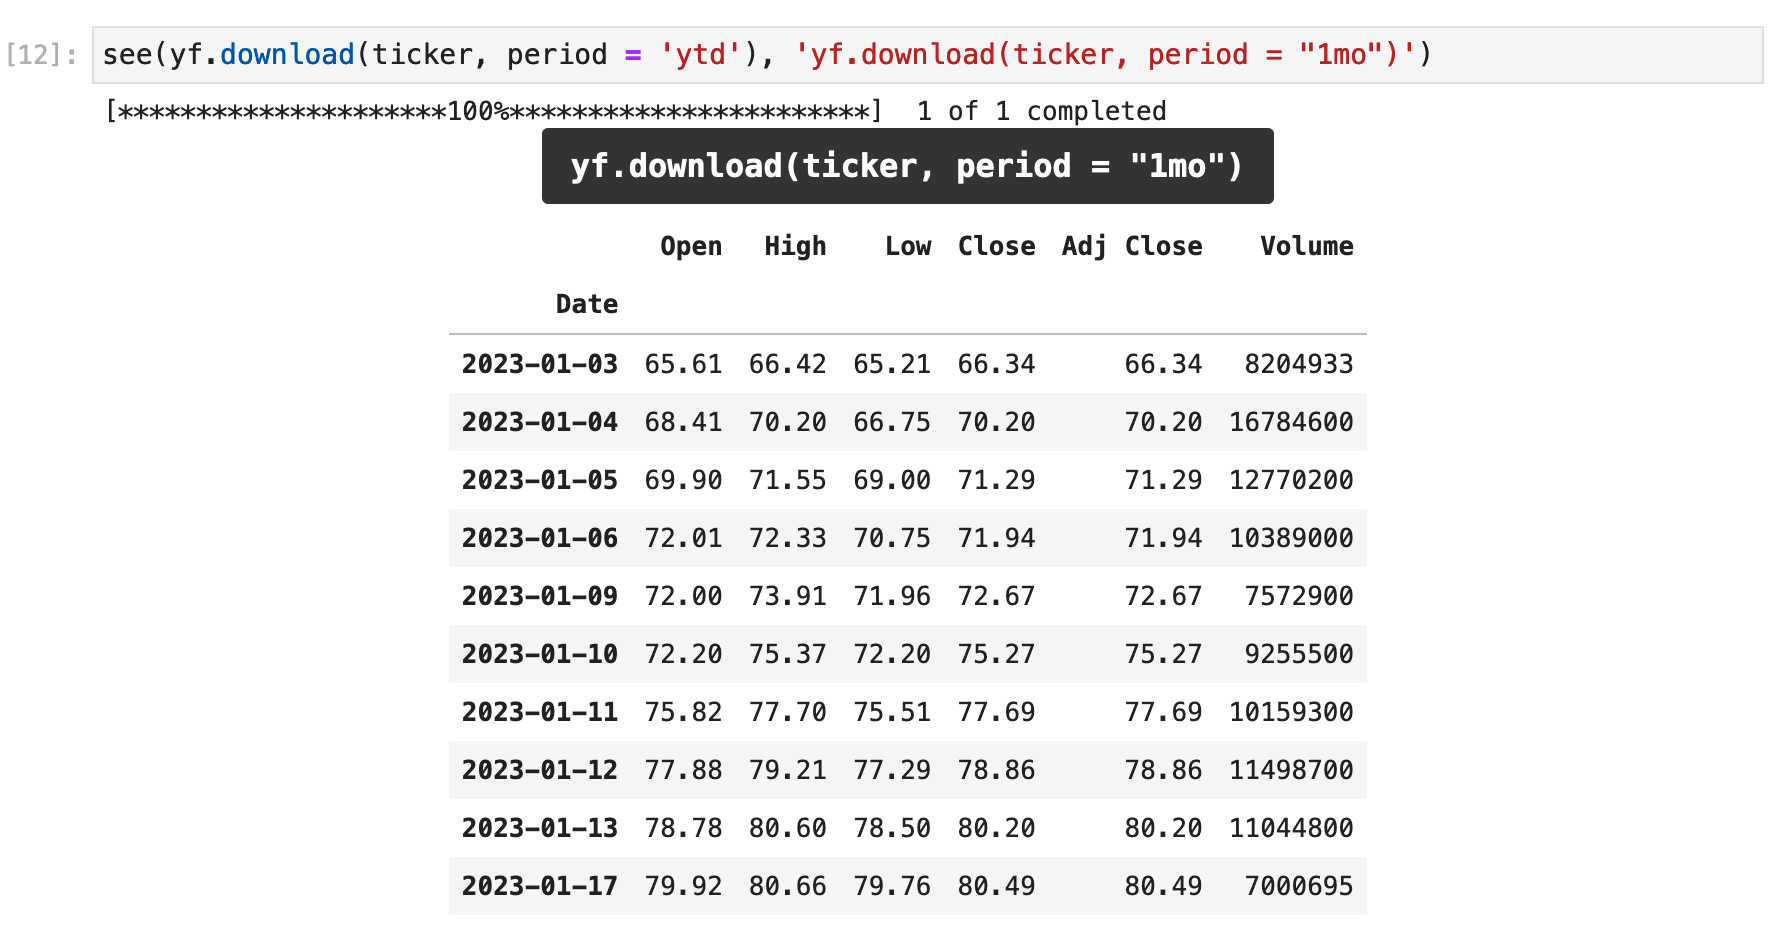
To get the data from the most recent month of trading, we can pass period = "1mo". Likewise, we can pass any number of months, as long as the company whose ticker is passed had valid trading activity, and get data on those, i.e period = "2mo", and so forth.
To get a specific date range, we can use the start and end parameters with yf.download(). This way we can specify the exact beginning and end of our time range and retrieve all the data for the stock fluctuations within that given range.
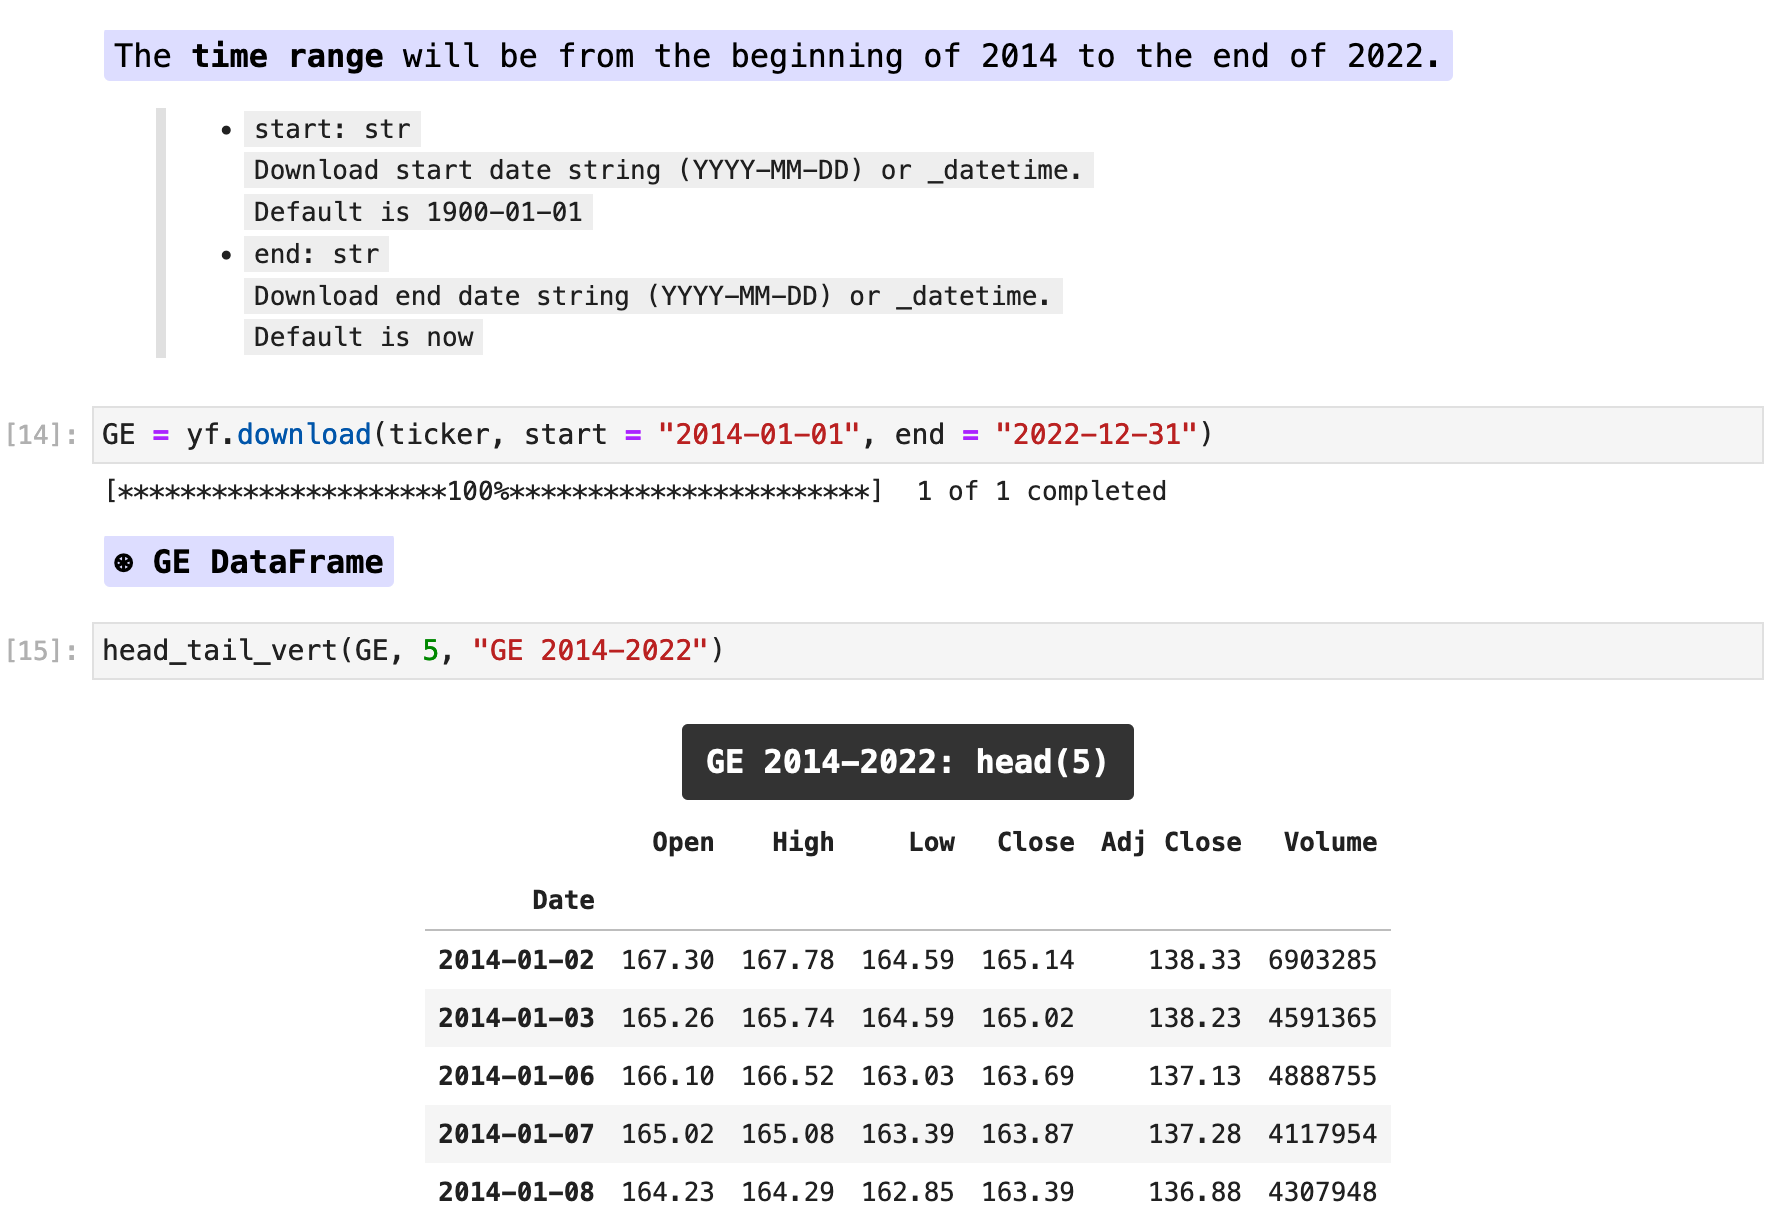
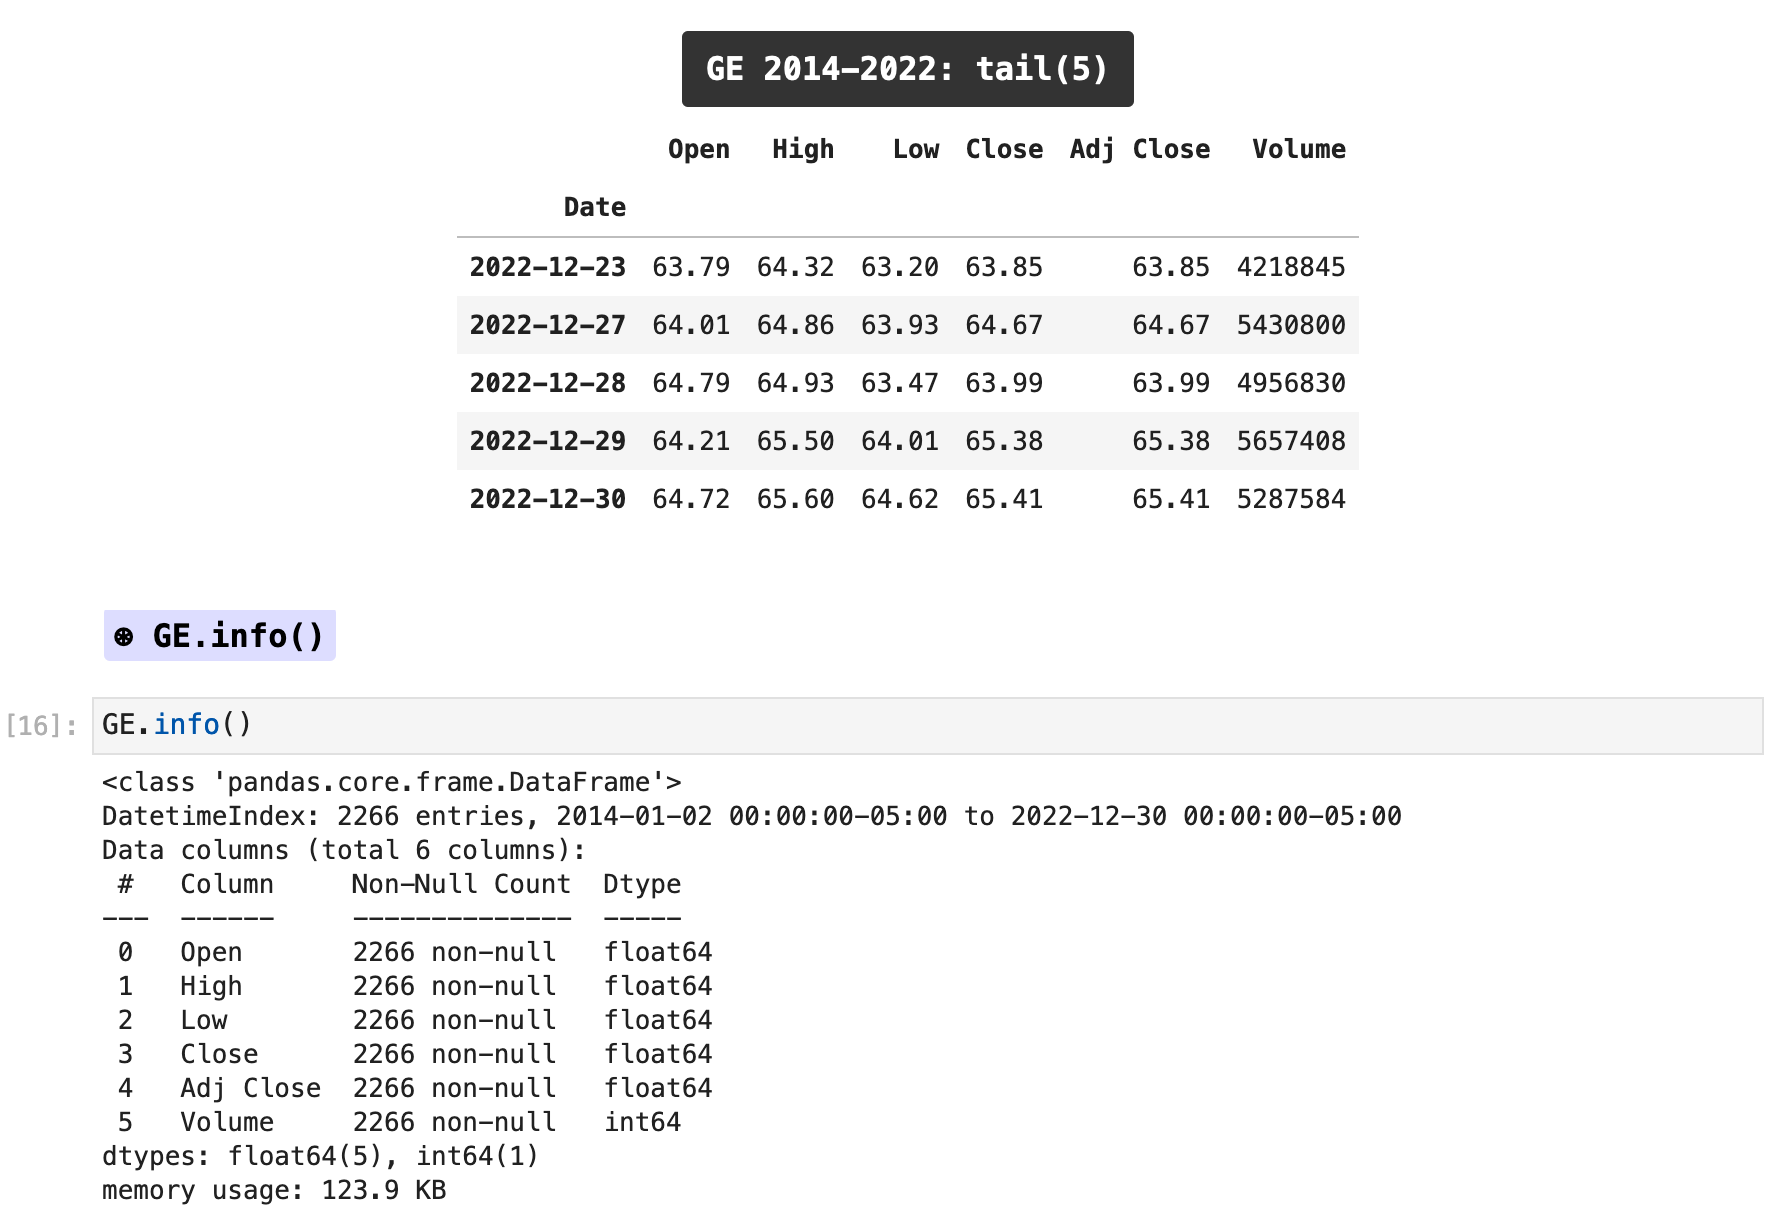
And since I have saved the data as the dataframe “GE”, I am able to get information about my new dataset with Pandas’ methods like info(). Between my specified start and end dates passed to yf.download() there are 2,266 trading days of information.
The following is the code for see(), which I use to present most dataframes in my notebooks for more clear labeling, centering, and clearer explanation.

Sections: ● Top ● Historical Data ● Setting Date Range ● High Frenquency ● Splits & Dividends ● Exporting ● Multiple Stocks ● Importing Indexes ● Currency Exchange ● Cryptocurrencies ● Mutual & Exchange Traded Funds ● Treasury Yields ● Ticker Object & Docs ● Stock Fundamentals ● Importing Financials ● Importing Put & Call Options ● Streaming Real-Time ●

For practical use in trading, it is important to be able to retrieve more than just historical stock prices with Yahoo Finance. For this, we will use the interval parameter. Below, you can see the results for using a period="1mo" and various intervals: interval="1h", interval="30m", interval="5m", and period="5d",interval="1m". Note that when using interval="1m", the period cannot be longer than "5d".

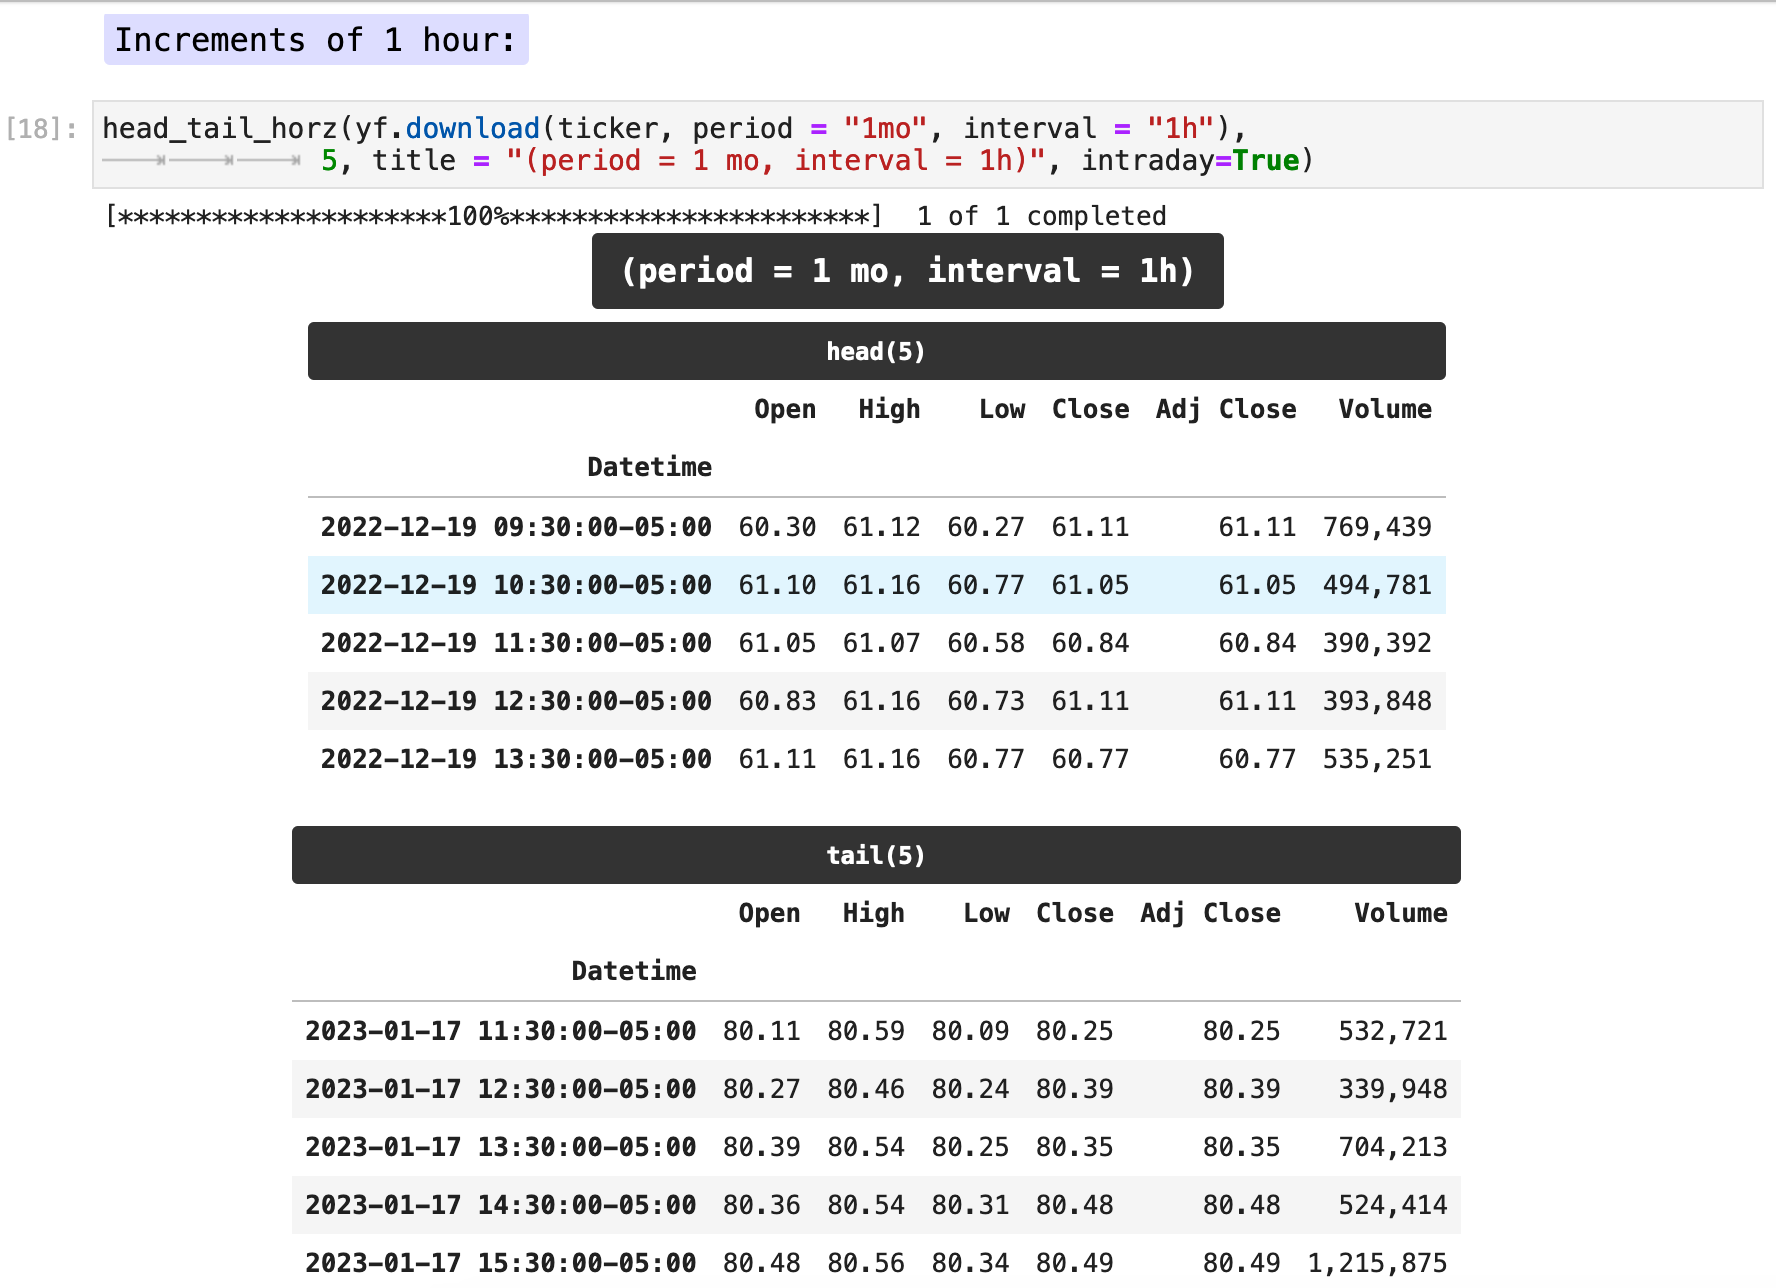
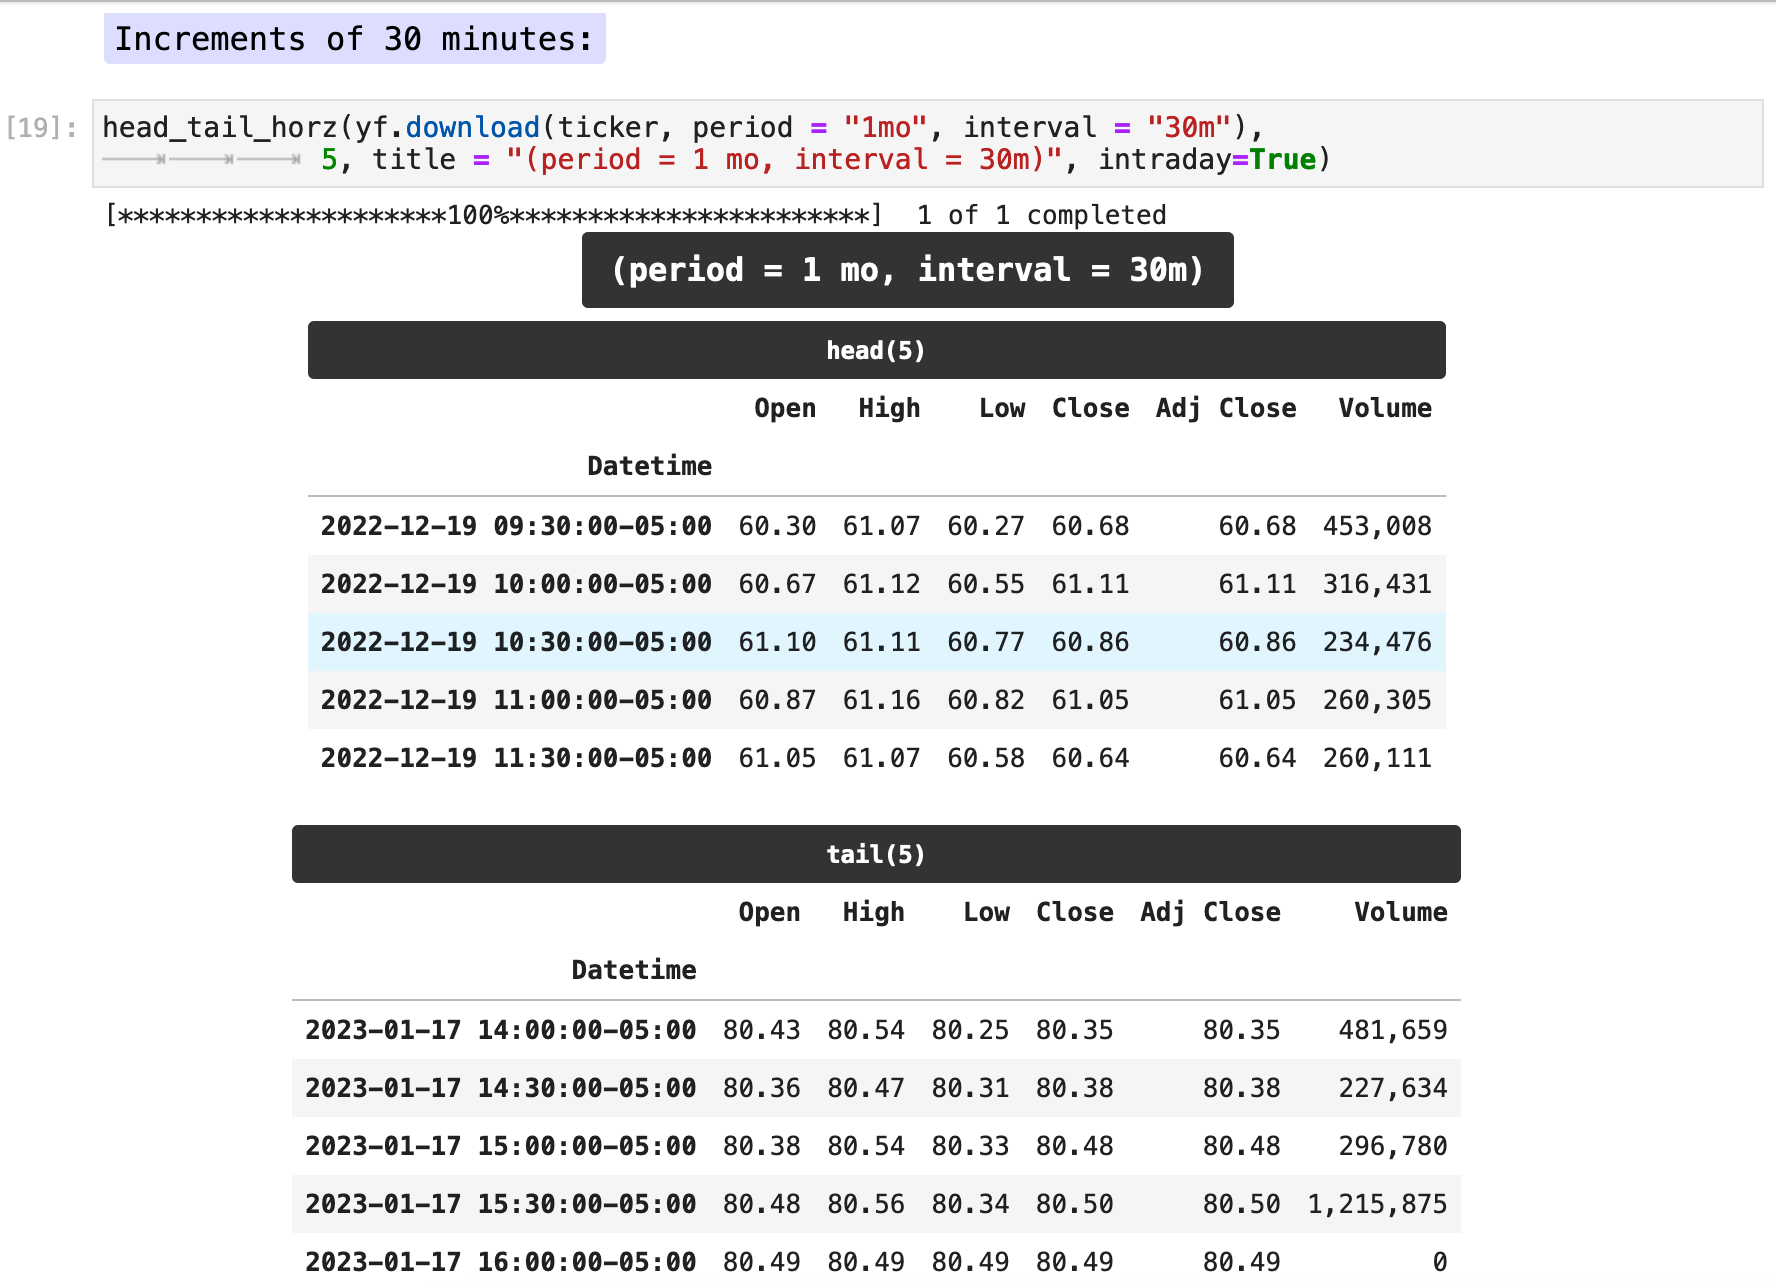
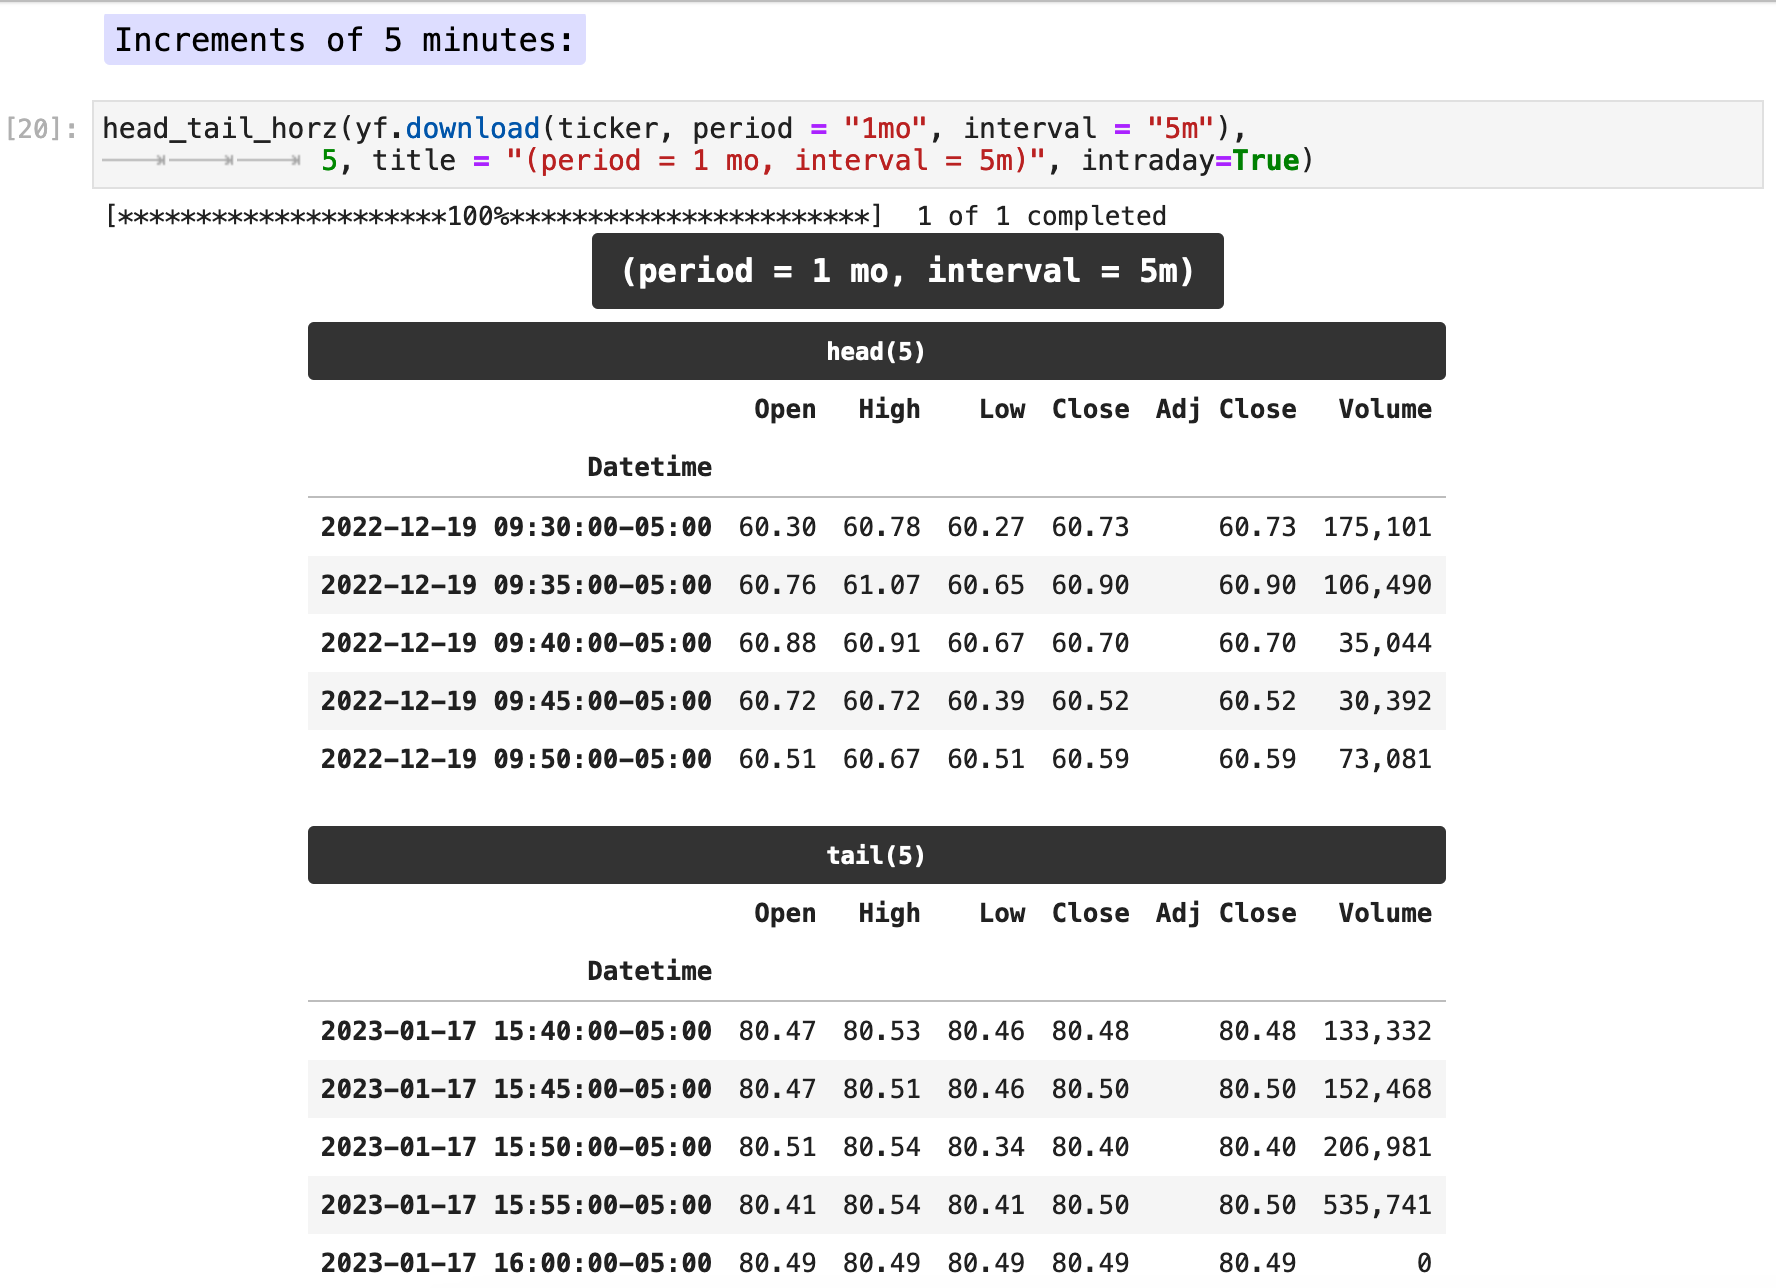
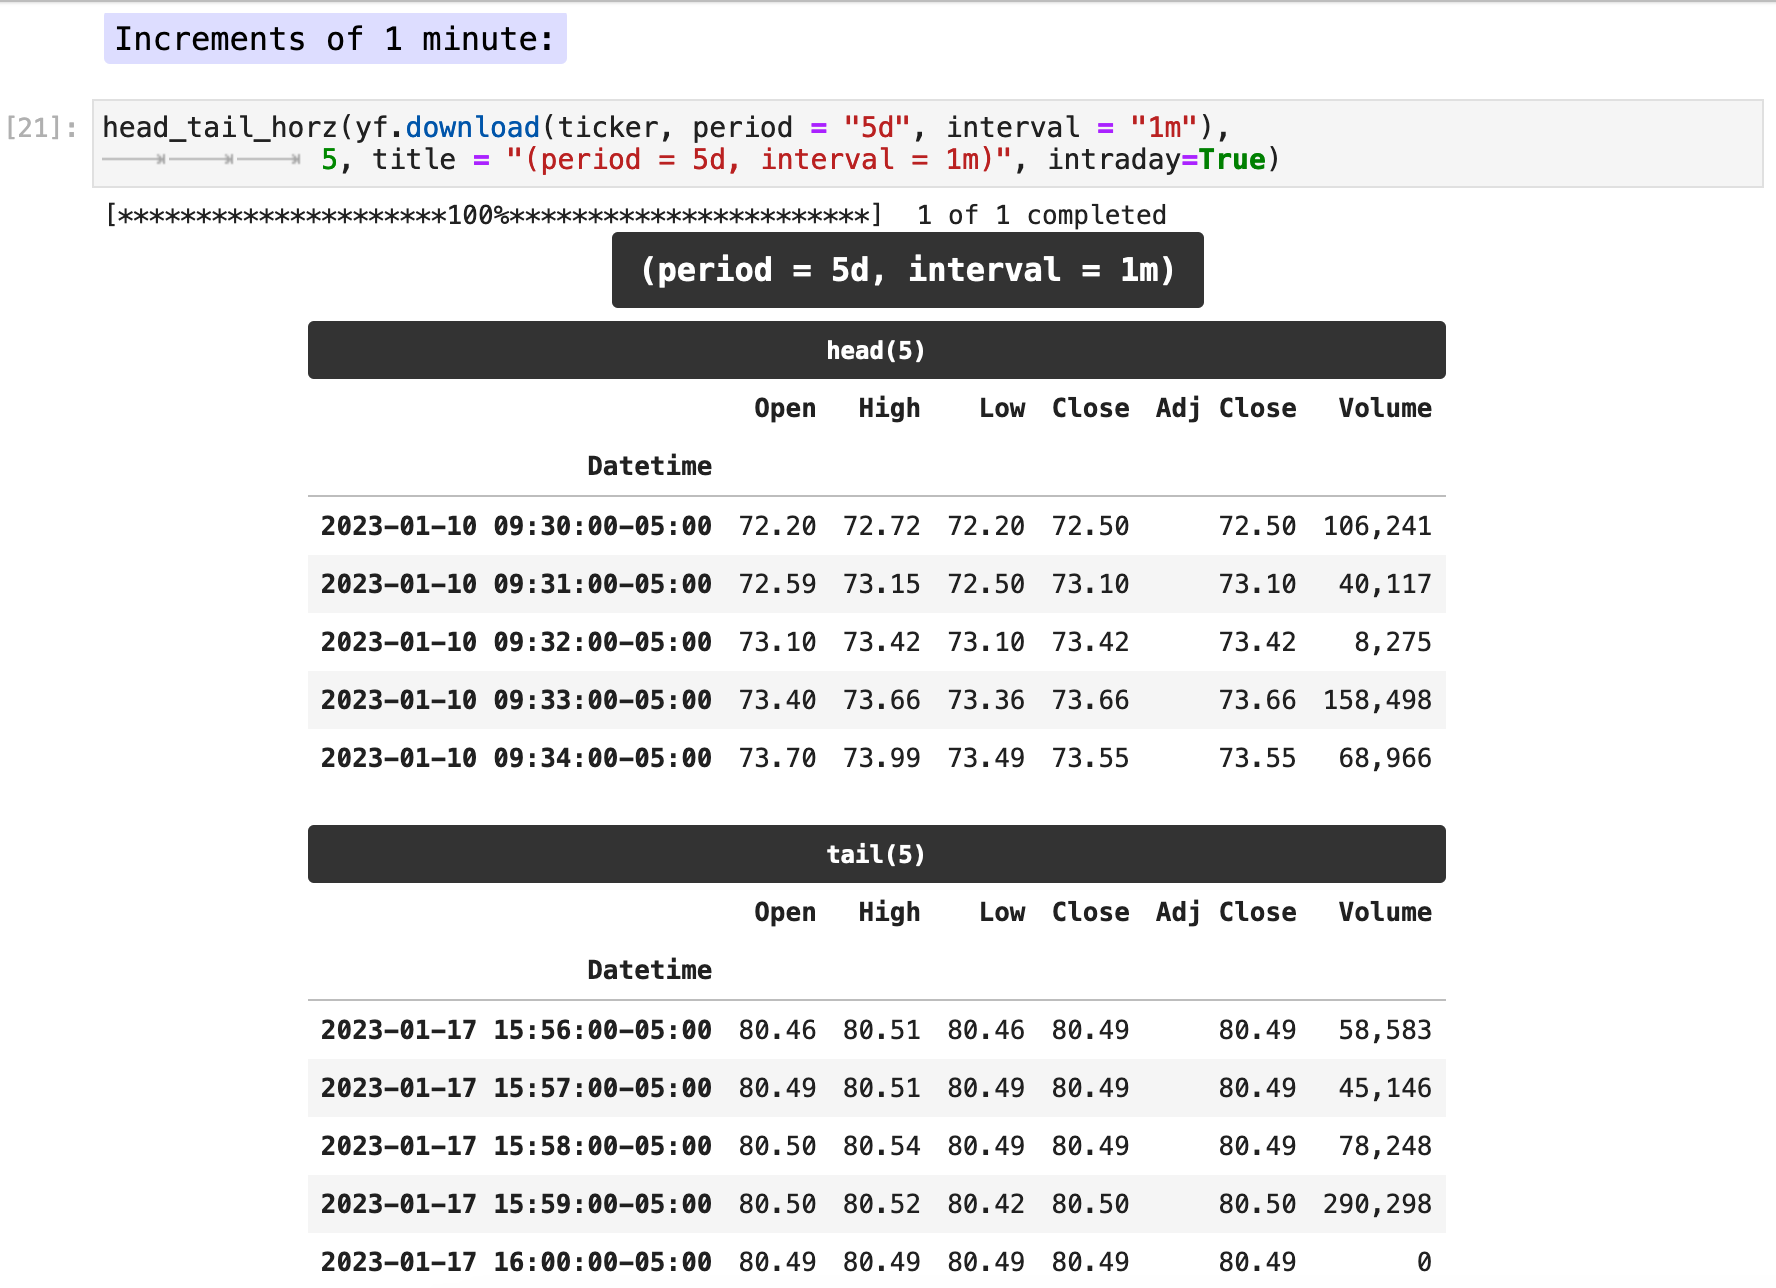
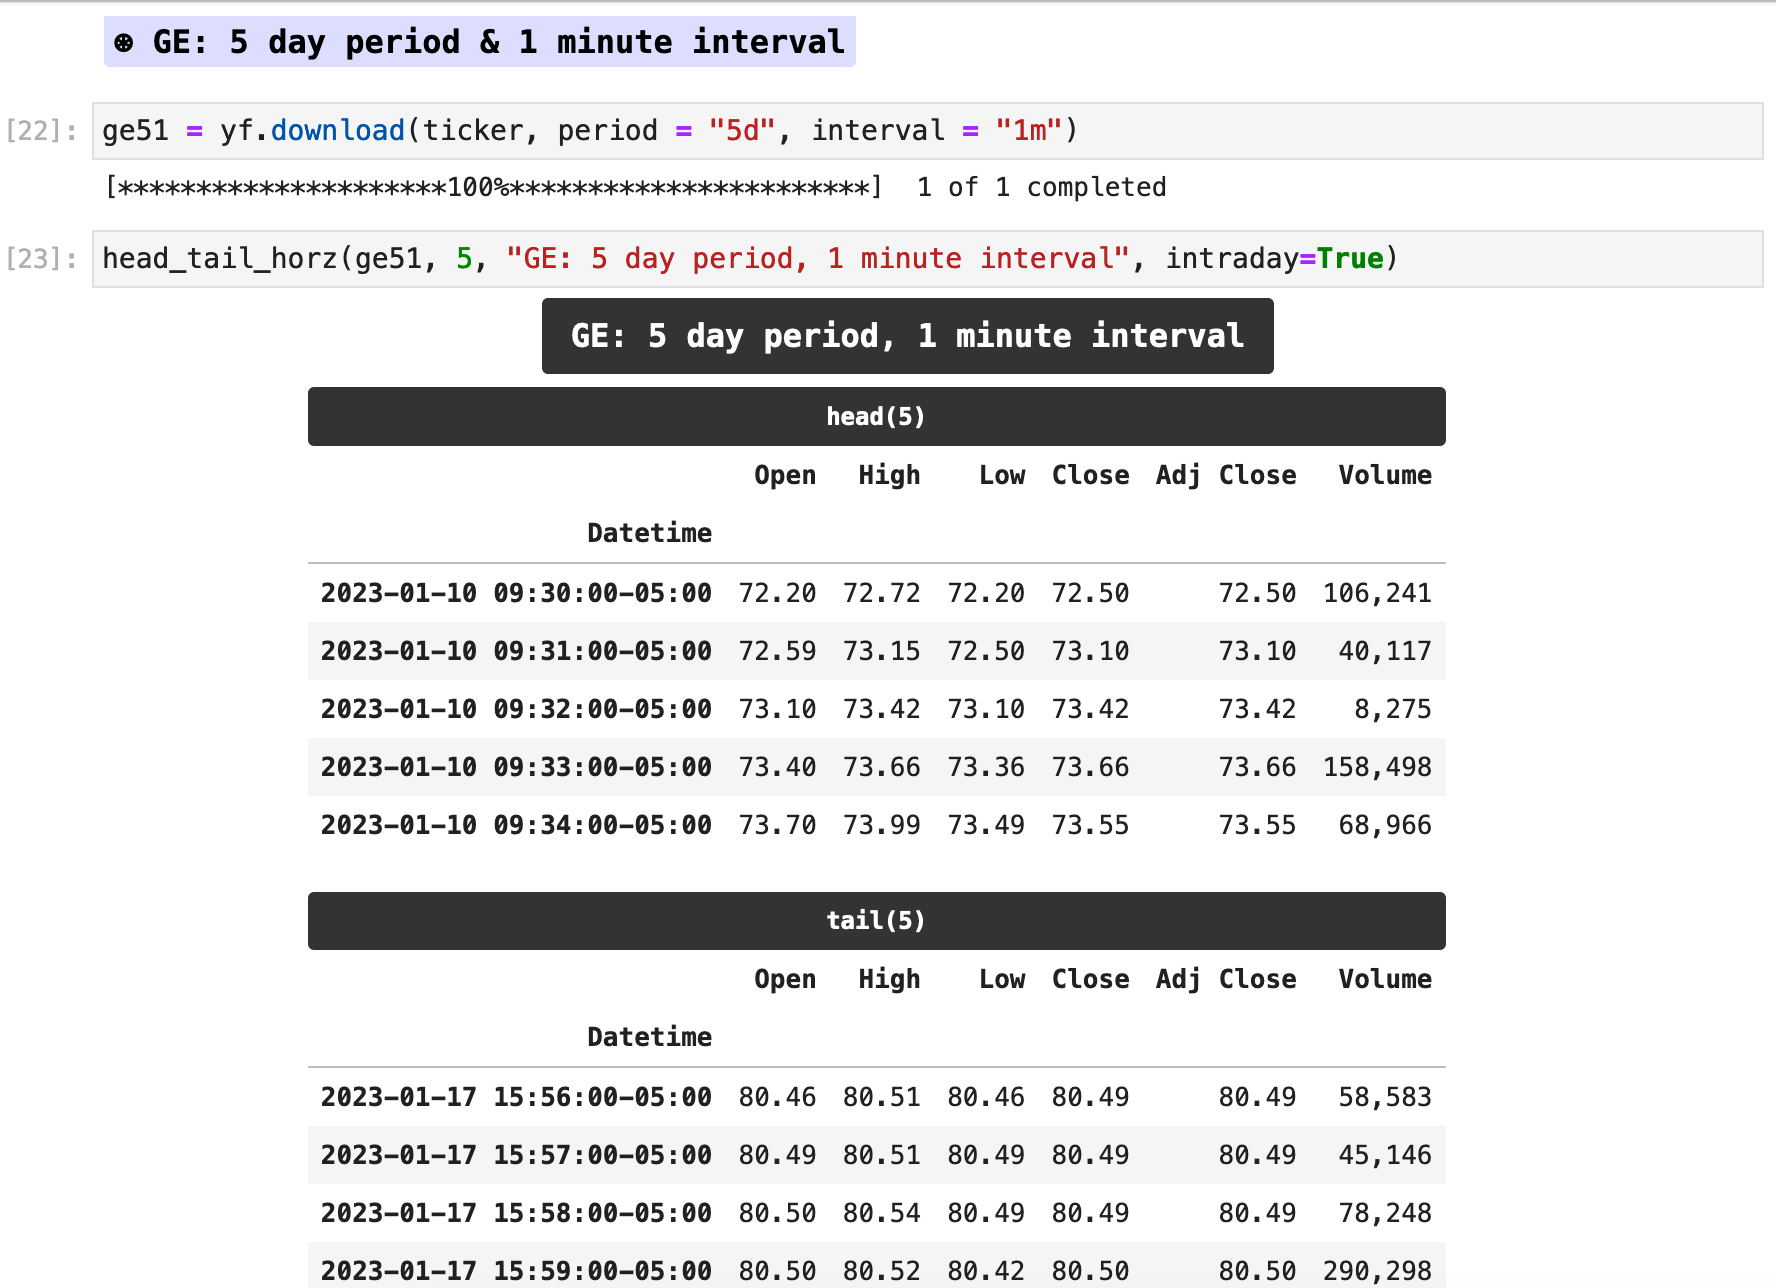
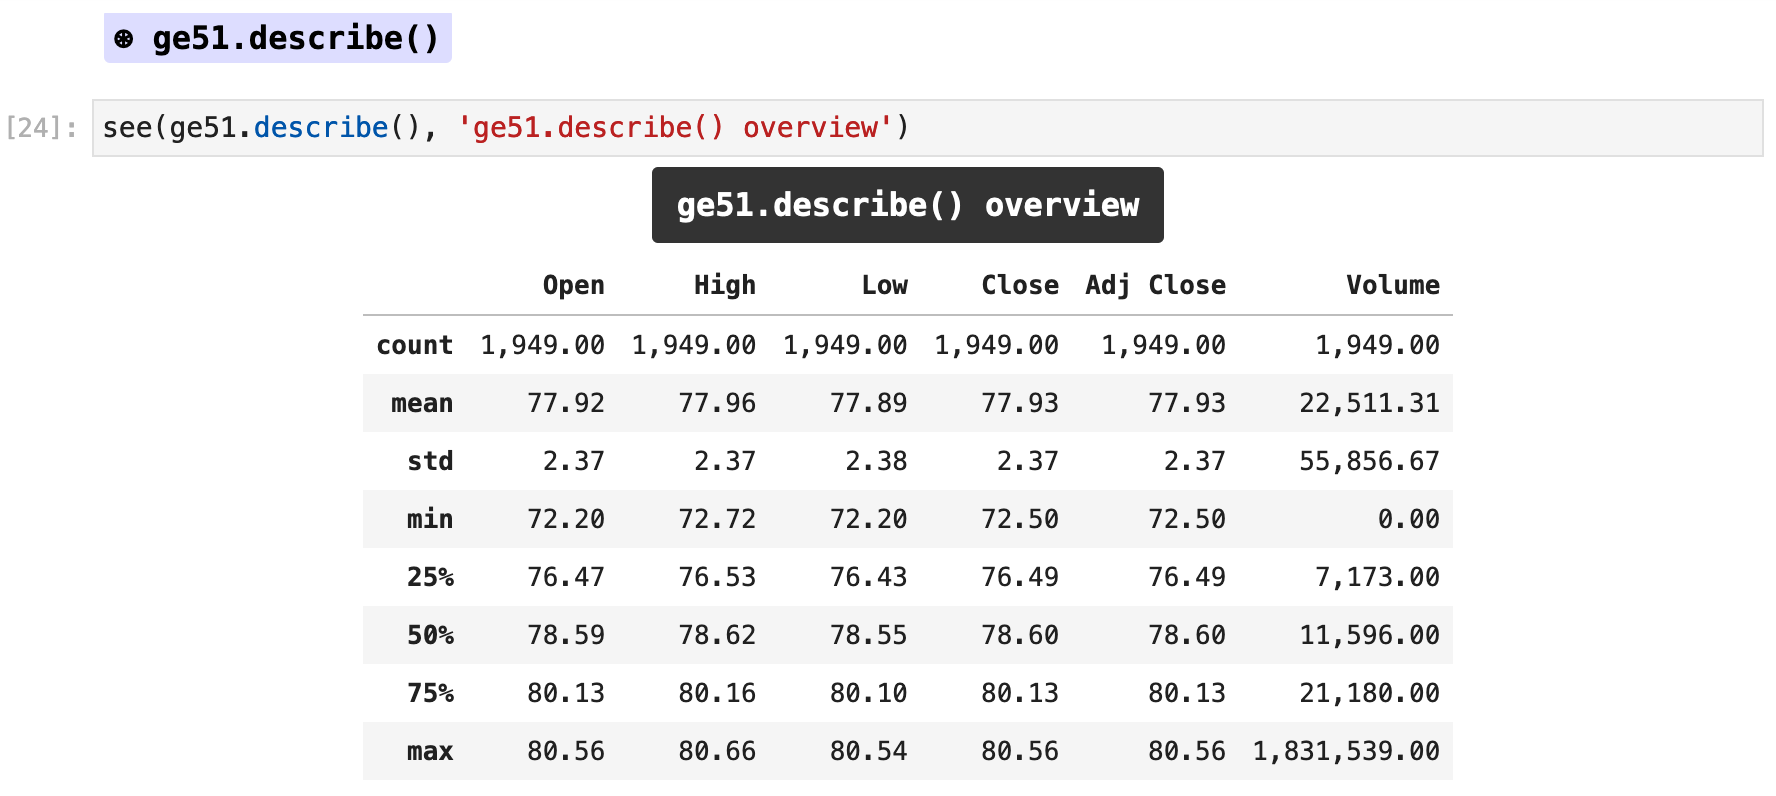
I have saved the dataframe for GE with a period of 5 days and interval of 1 minute. So now it is possible to gather more information about this data. Using .describe() we can get the overall statistical data for the new dataframe.
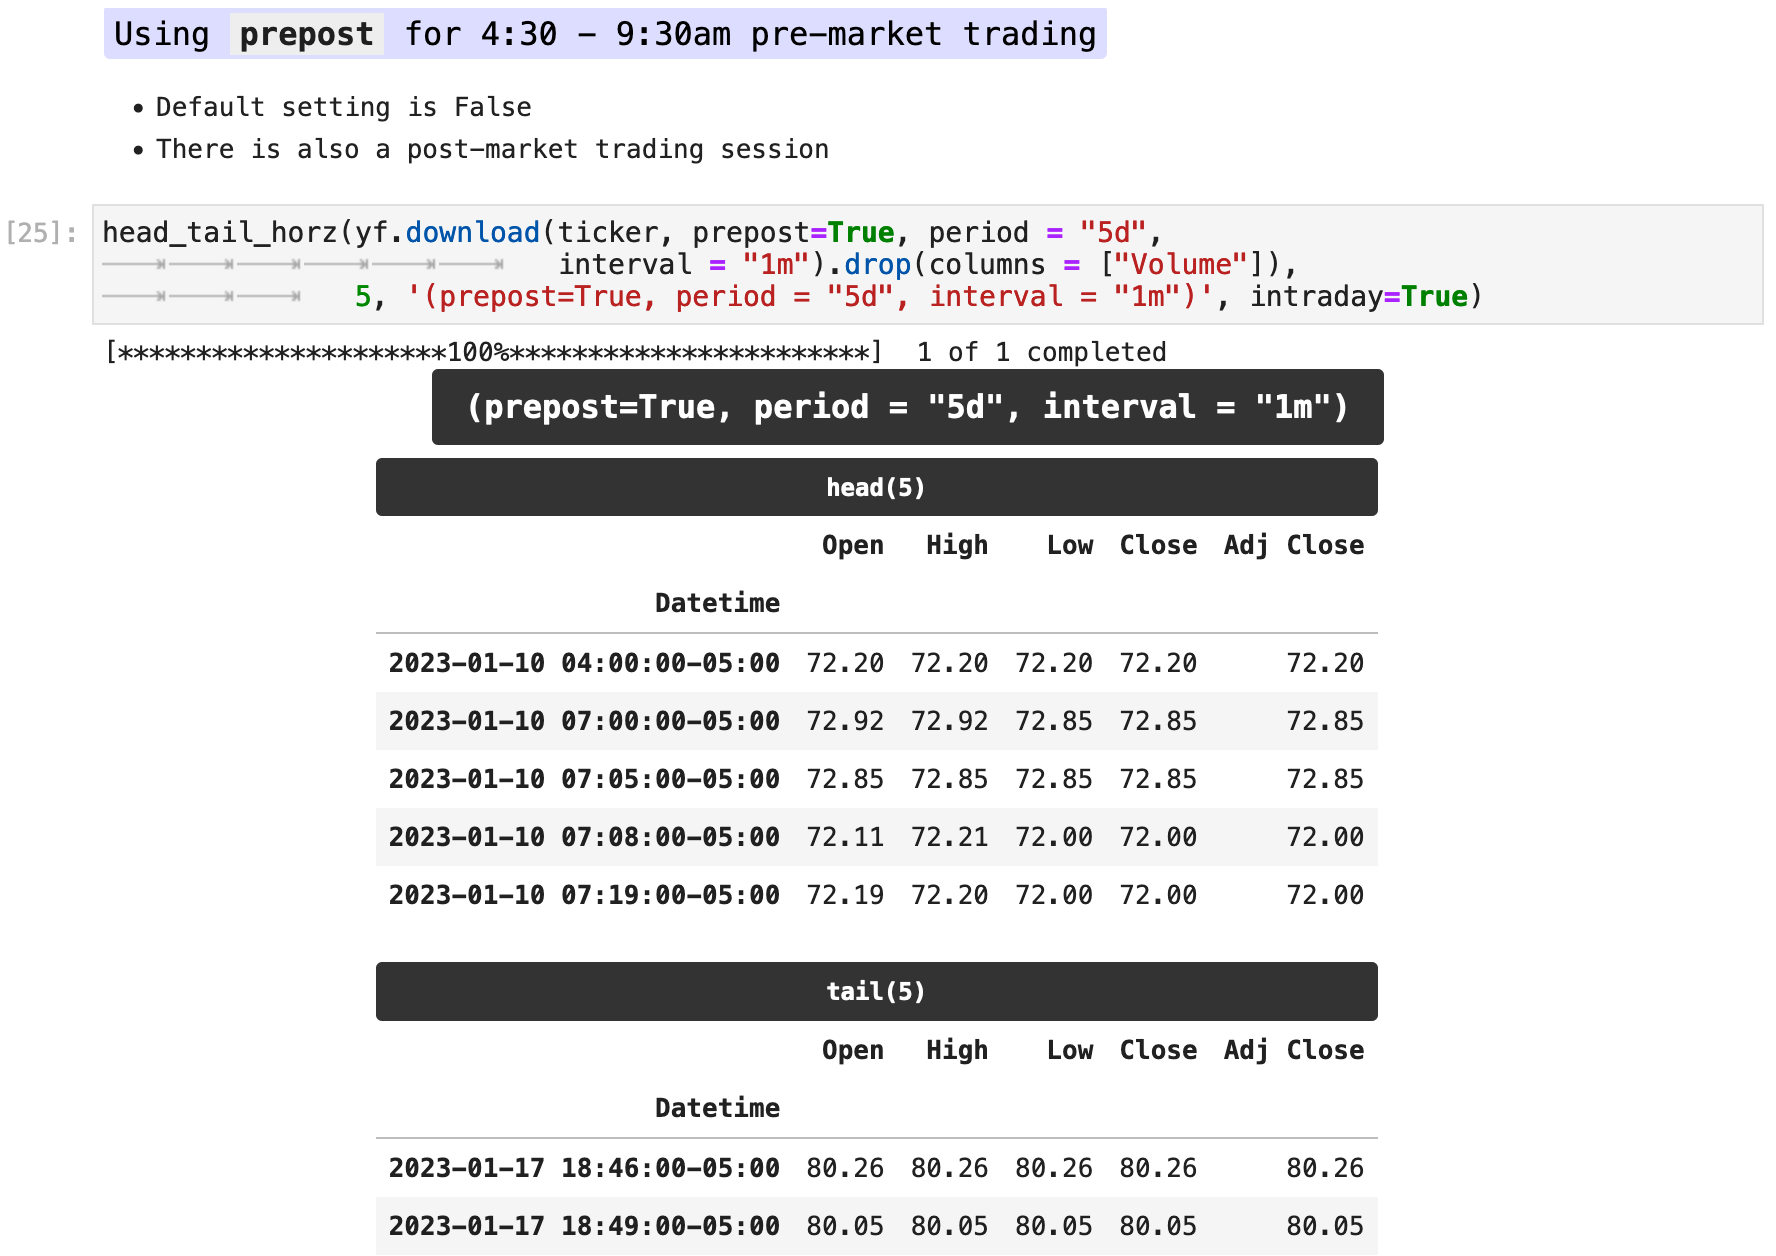
By using prepost=True, we can also get the data for before market hours trading.

Sections: ● Top ● Historical Data ● Setting Date Range ● High Frenquency ● Splits & Dividends ● Exporting ● Multiple Stocks ● Importing Indexes ● Currency Exchange ● Cryptocurrencies ● Mutual & Exchange Traded Funds ● Treasury Yields ● Ticker Object & Docs ● Stock Fundamentals ● Importing Financials ● Importing Put & Call Options ● Streaming Real-Time ●

One aspect of trading that can be slightly confusing is the changes caused by stock splits and dividend adjustments. When inspecting stock data, the Close column and the Adjusted Close column can feel a bit misleading if you do not understand how dividends affect them. The Adjusted Close column accounts for dividends, where the Close column does not, which means that often the Adjusted Close column reflects a more accurate portrayal of the performance of a stock.
By passing the parameter actions = True, we can also obtain the dividend and stock split data along with the default data returned by passing a ticker symbol to yf.download().
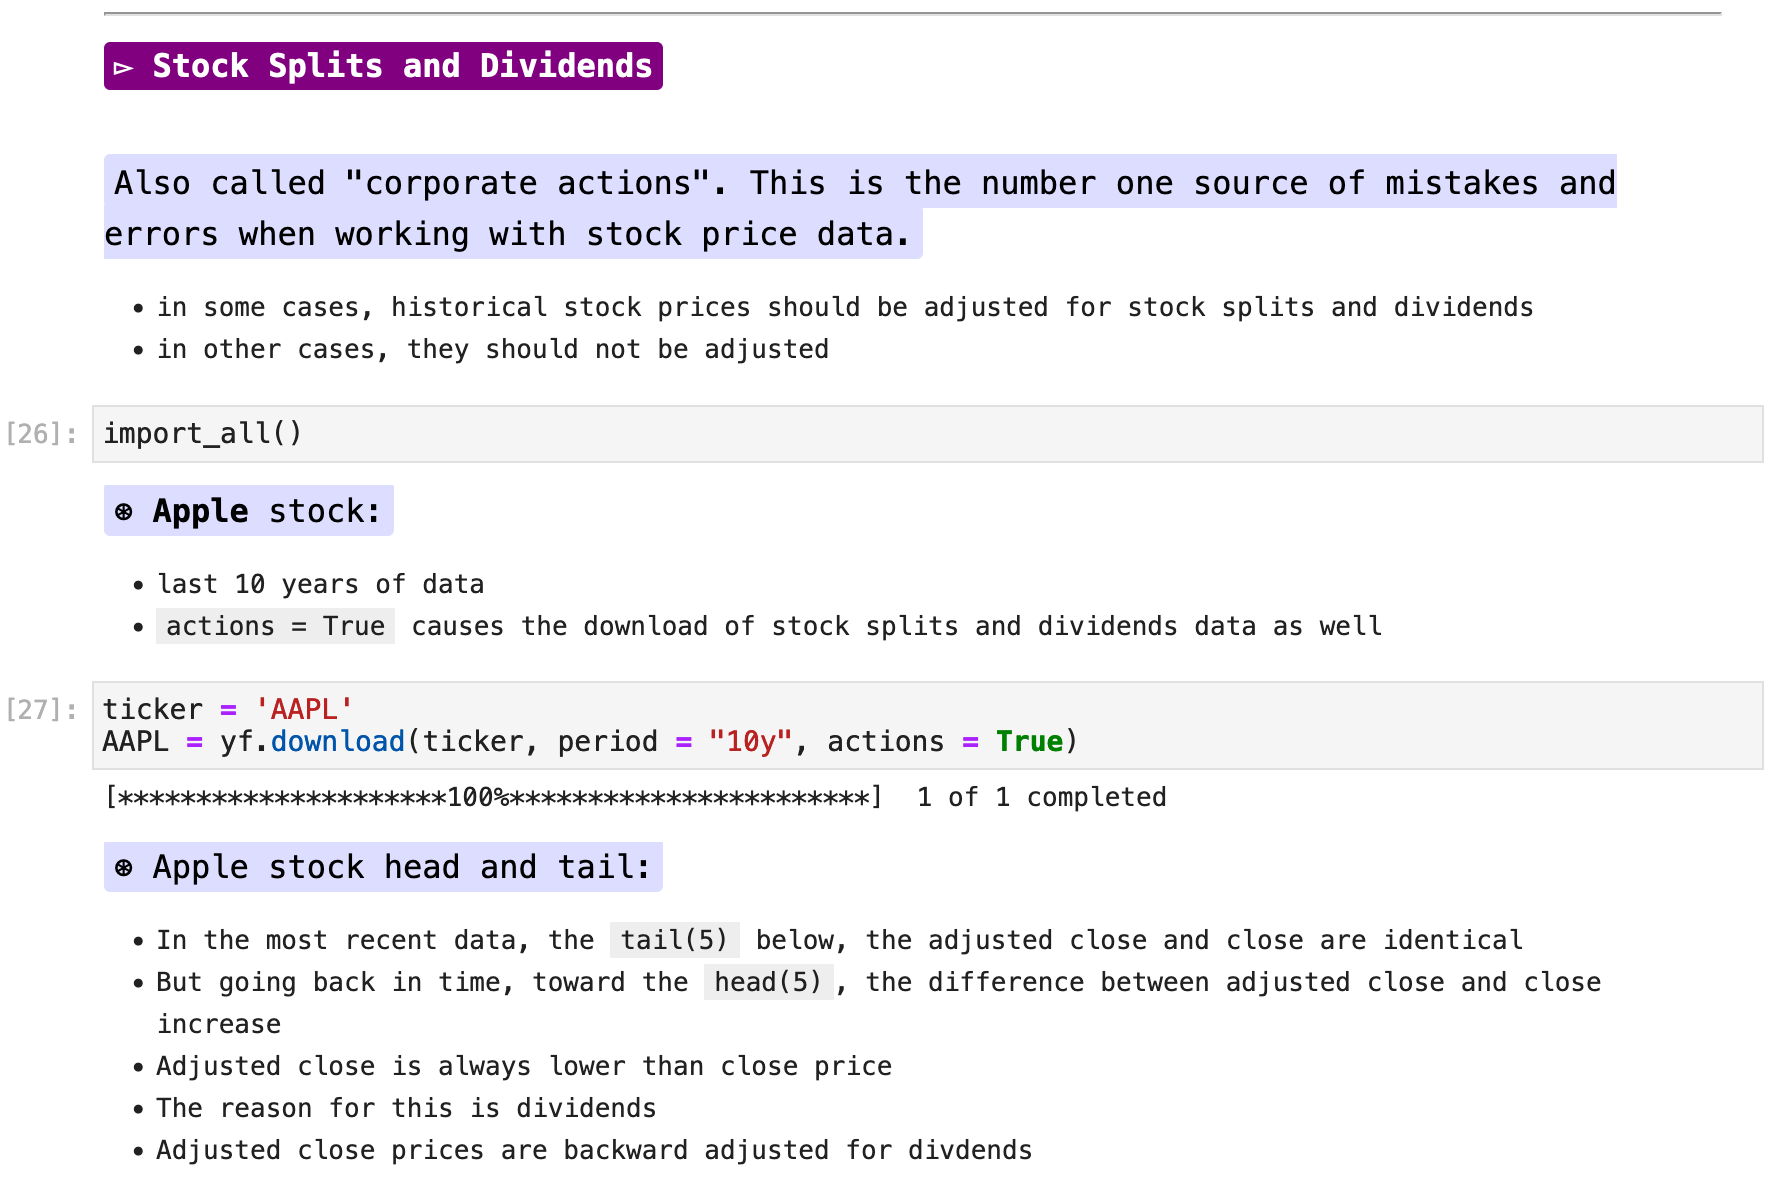
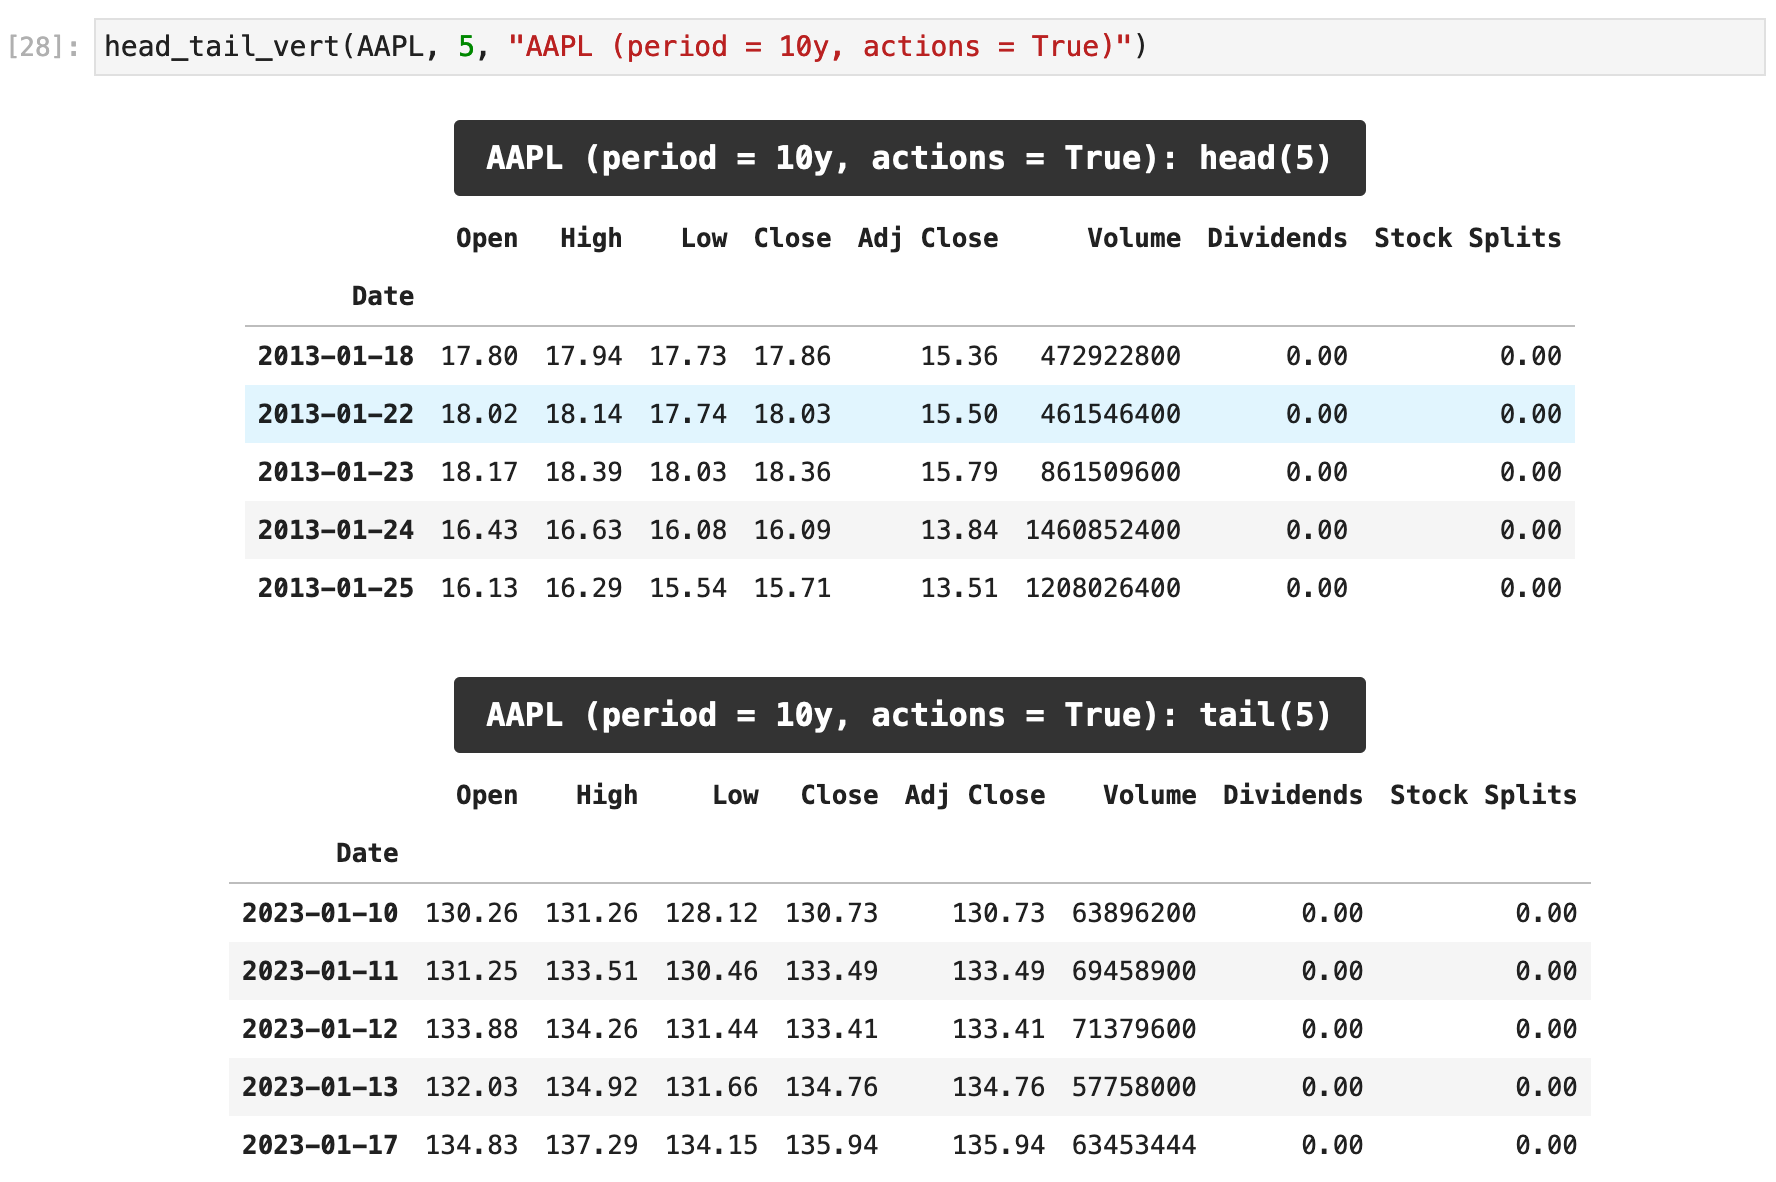
As you can see below, very few of the records for the Apple stock (ticker symbol AAPL) contain dividend or stock split data. That is because dividends usually occur quarterly, if they occur at all. And stock splits only occur any time a company decides to split. So the dividends and stock splits fields most often contain empty values.
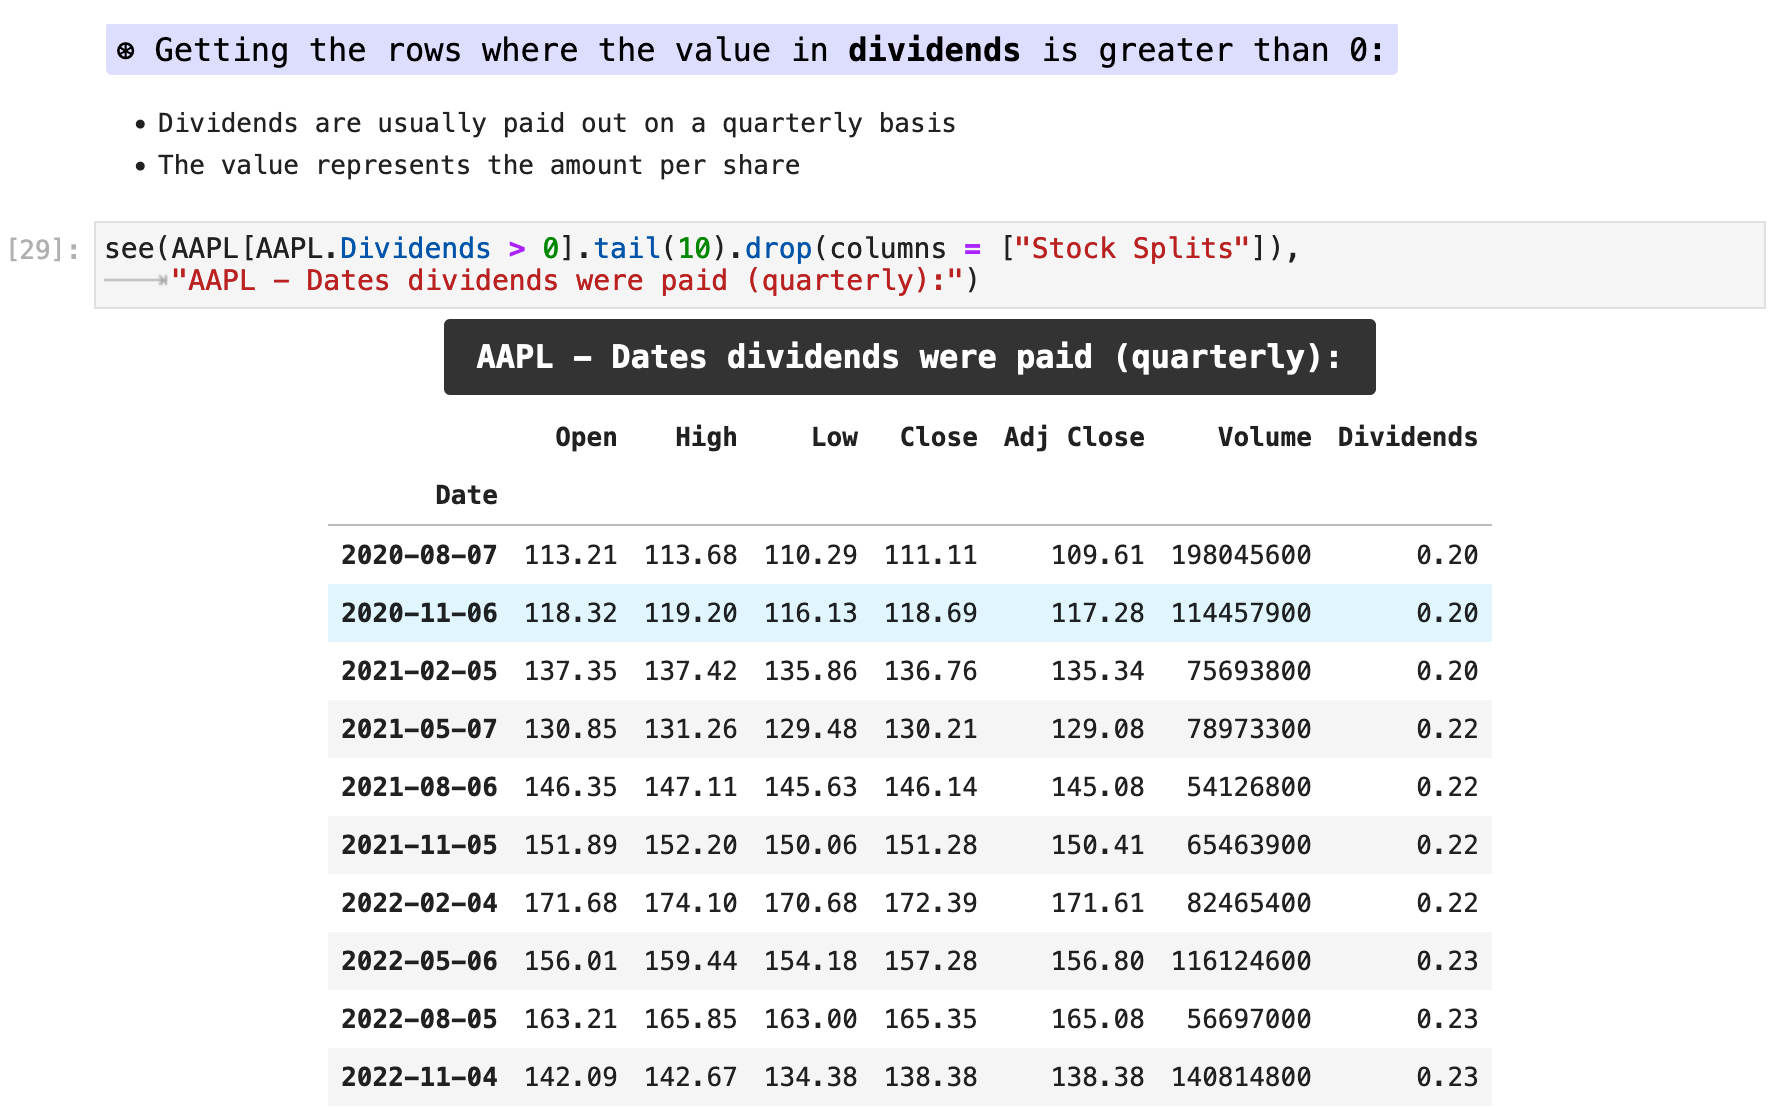
By filtering the data to only rows containing dividends of greater than 0, we can see each time Apple paid dividends to its investors. As expected, by looking at the dates for these records, we can see that this is a quarterly occurrence.
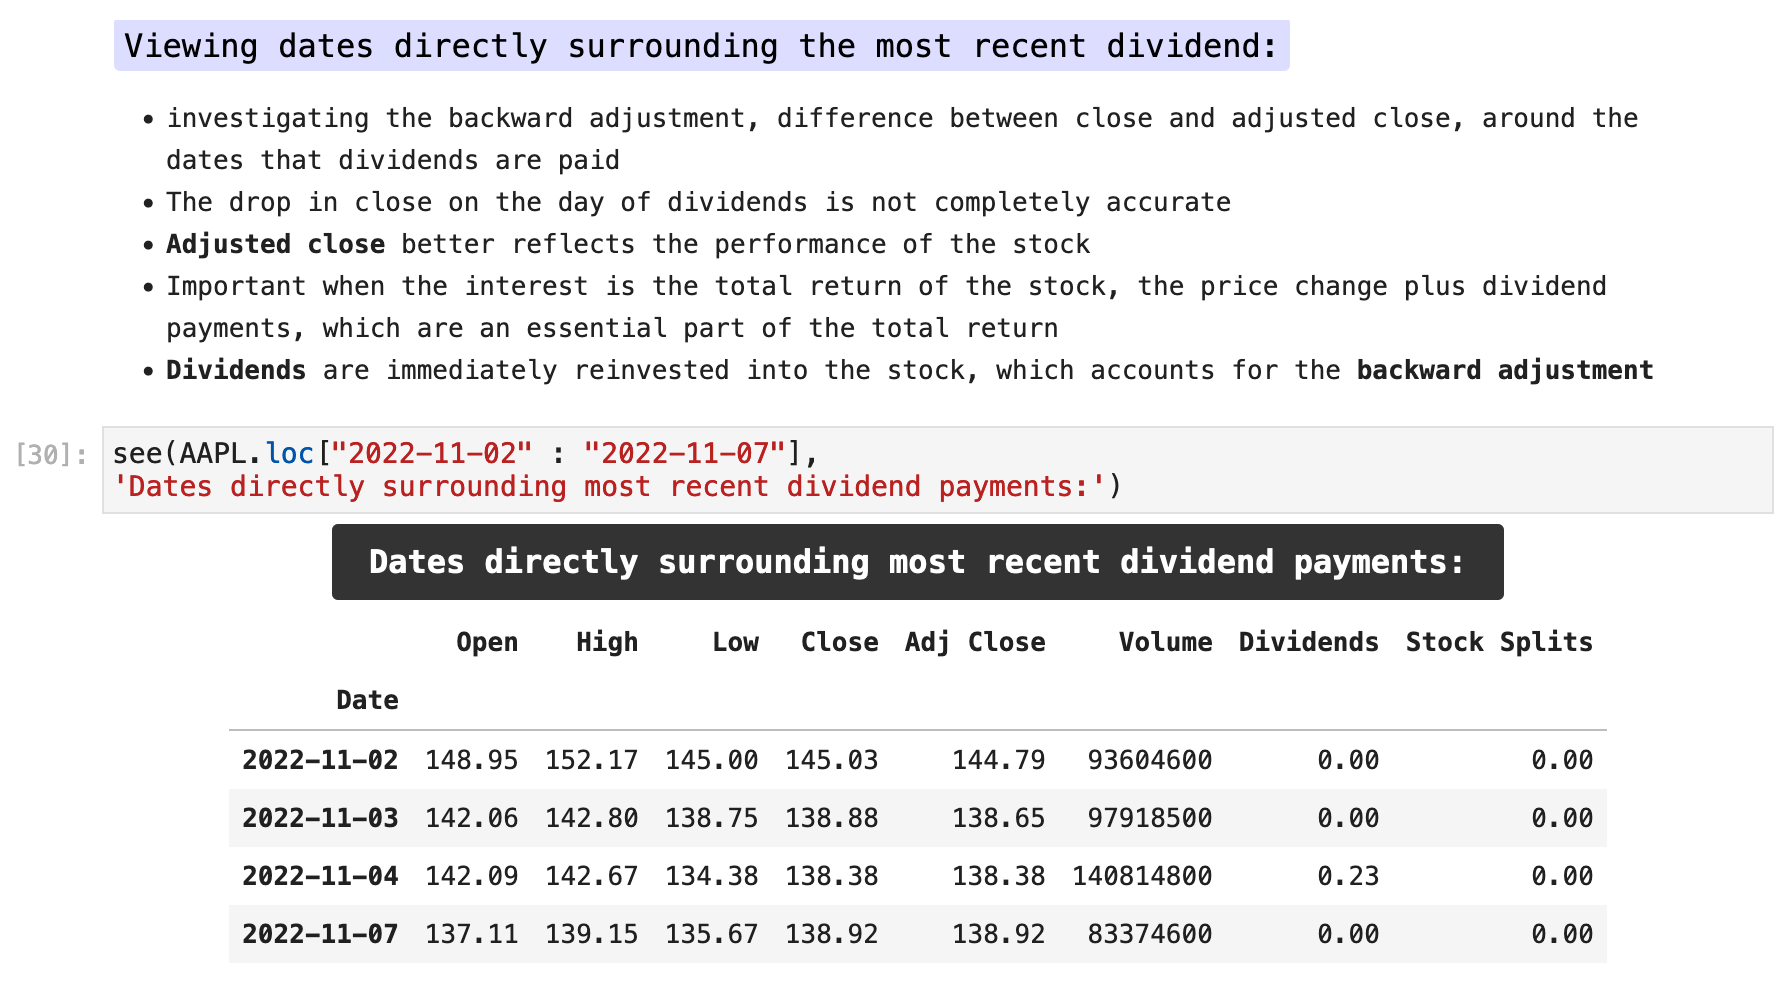
We can now inspect the dates directly surrounding the most recent dividend payment and see how the Adjusted Close and Close columns contain identical values on the day of a dividend payment but then diverge more as the dates continue going backwards. This is because the adjusted close values are backward adjusted.
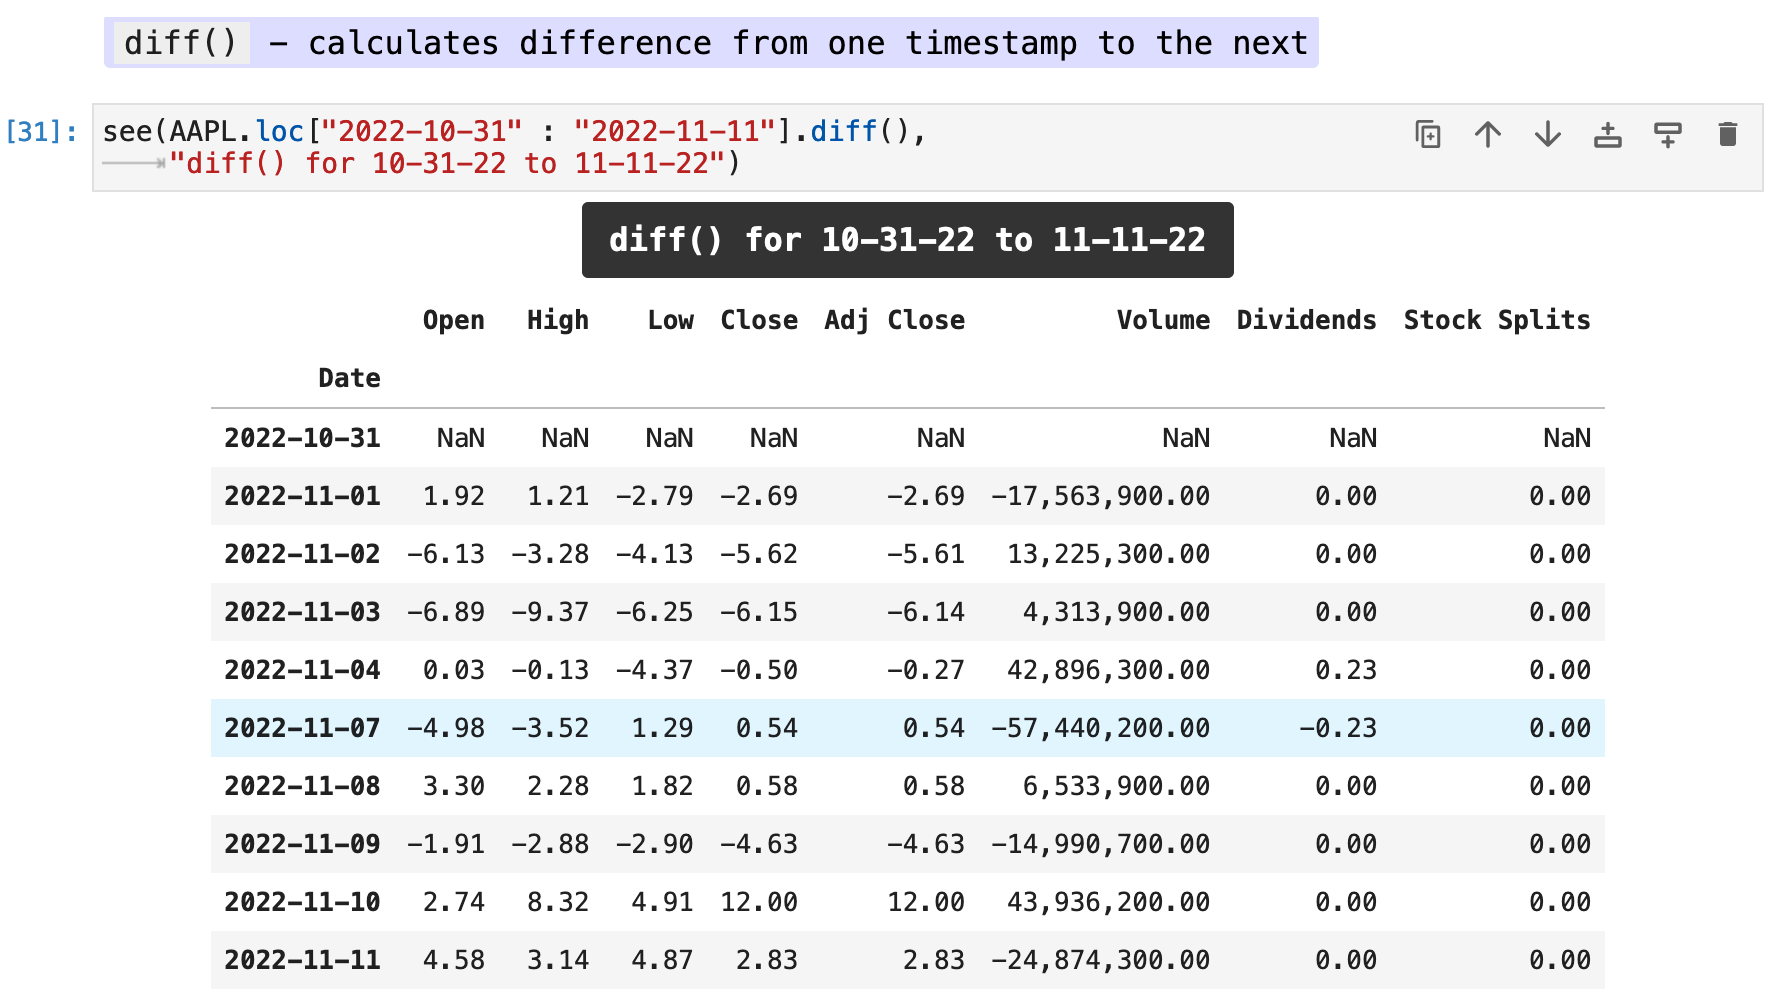
By using the .diff() method, we can get the difference between each value in each record and the previous day’s value for the same record. This way we can more easily observe the changes in values surrounding the day of a dividend payment.
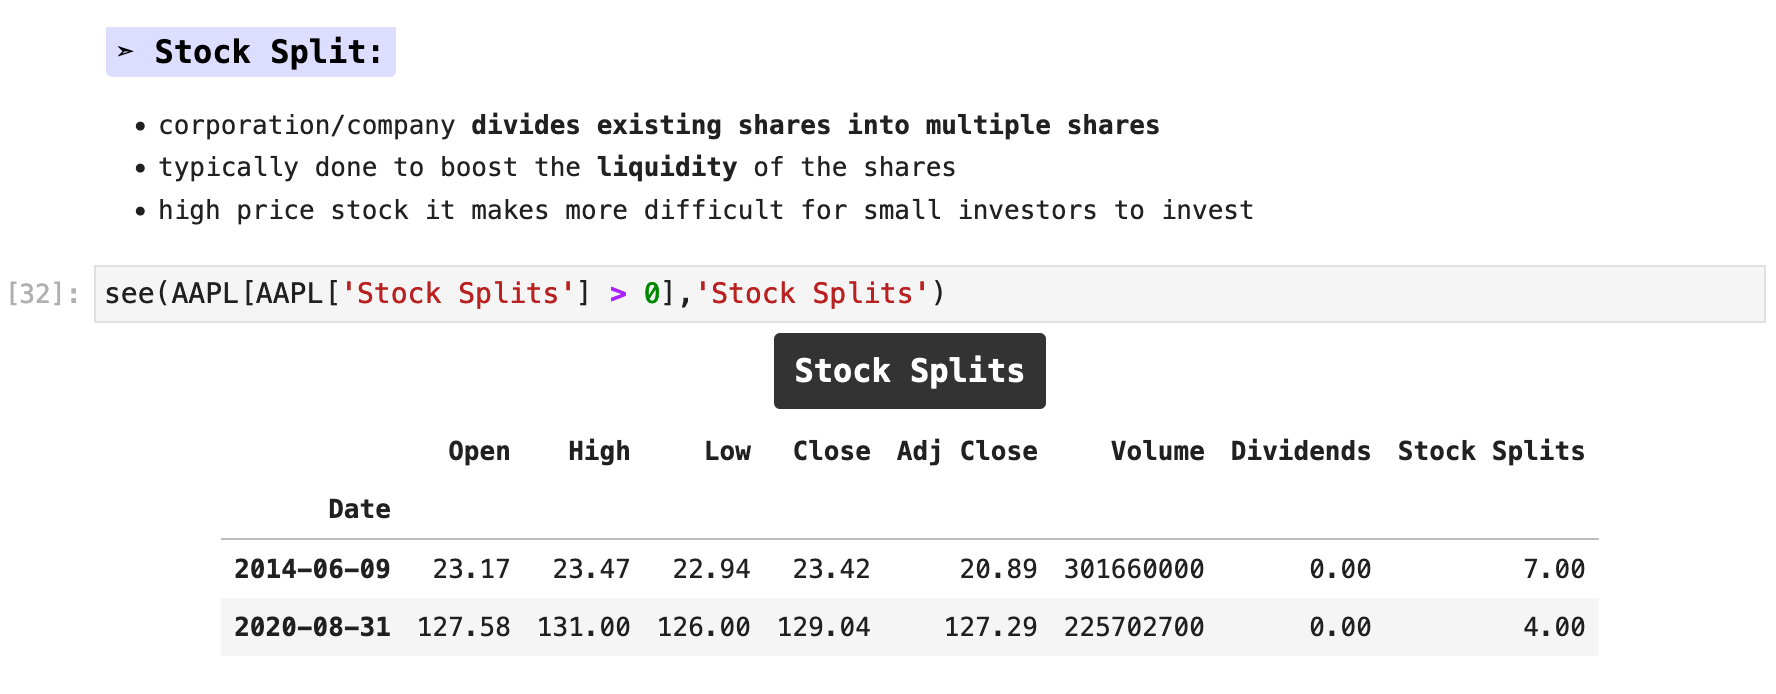
Stock splits take place when a company decides to divide a share of stock into multiple shares due to successful rise in stock prices. They do this so that smaller investors still have a chance to invest in their company. For example, below we can see that in the past 5 years Apple has split their stock twice, once in June of 2014 and once in August of 2020. In June of 2014, for every share of Apple stock an investor held, that share was converted to 7 shares at a lower price (the previous price divided by 7), still maintaining its previously held value. Likewise in 2020, there was a split by 4.
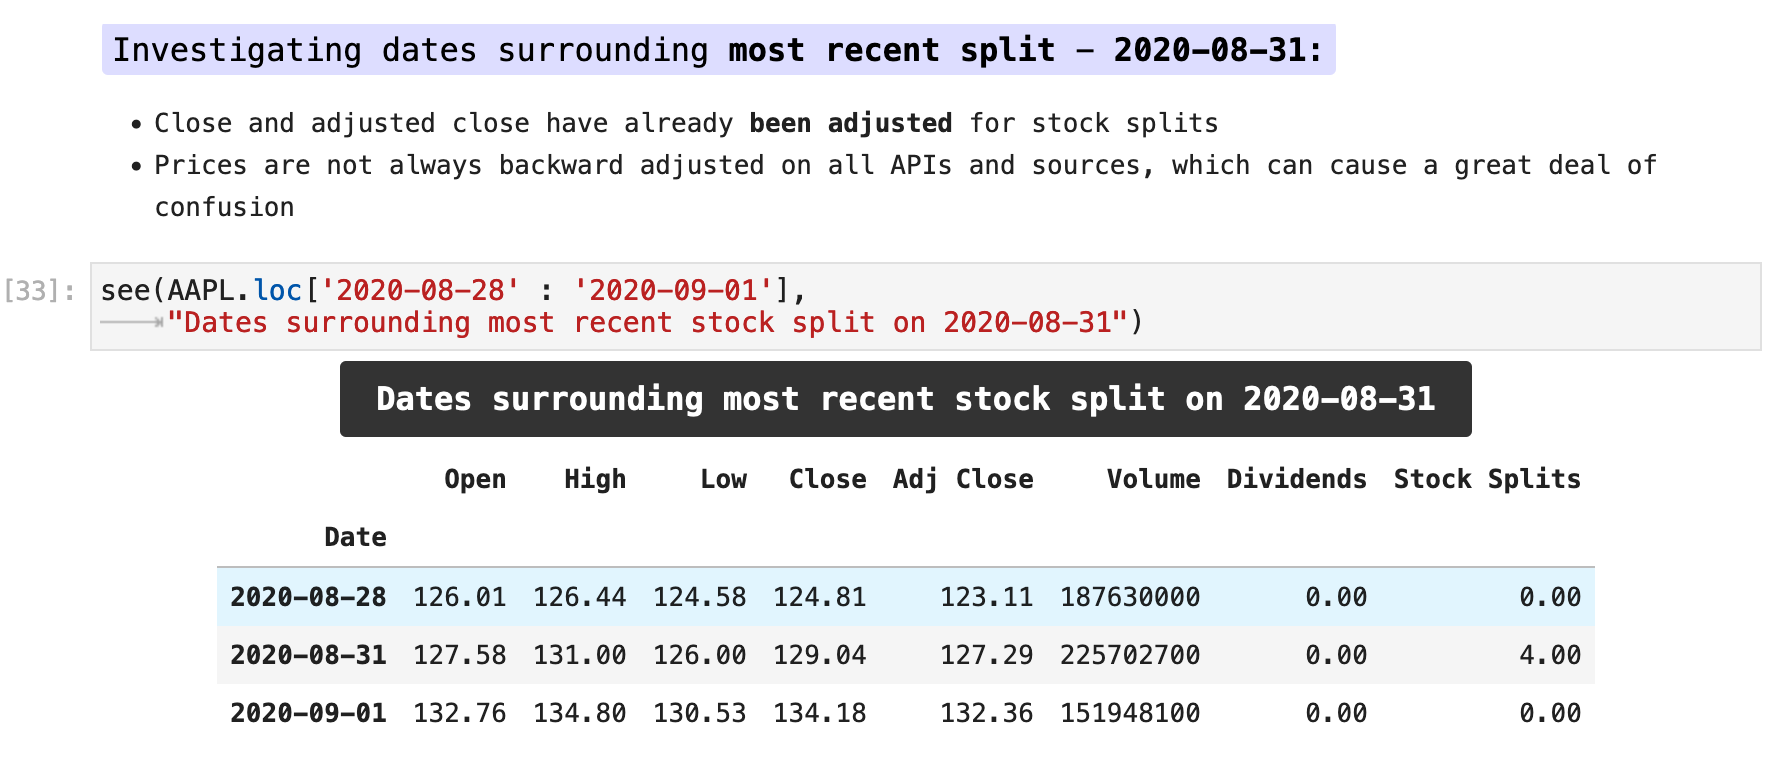
Just as the dividend information is factored into the data we retrieve from Yahoo Finance, the stock split data is factored in as well. So this can be confusing if a user does not take into account such adjustments.

Sections: ● Top ● Historical Data ● Setting Date Range ● High Frenquency ● Splits & Dividends ● Exporting ● Multiple Stocks ● Importing Indexes ● Currency Exchange ● Cryptocurrencies ● Mutual & Exchange Traded Funds ● Treasury Yields ● Ticker Object & Docs ● Stock Fundamentals ● Importing Financials ● Importing Put & Call Options ● Streaming Real-Time ●

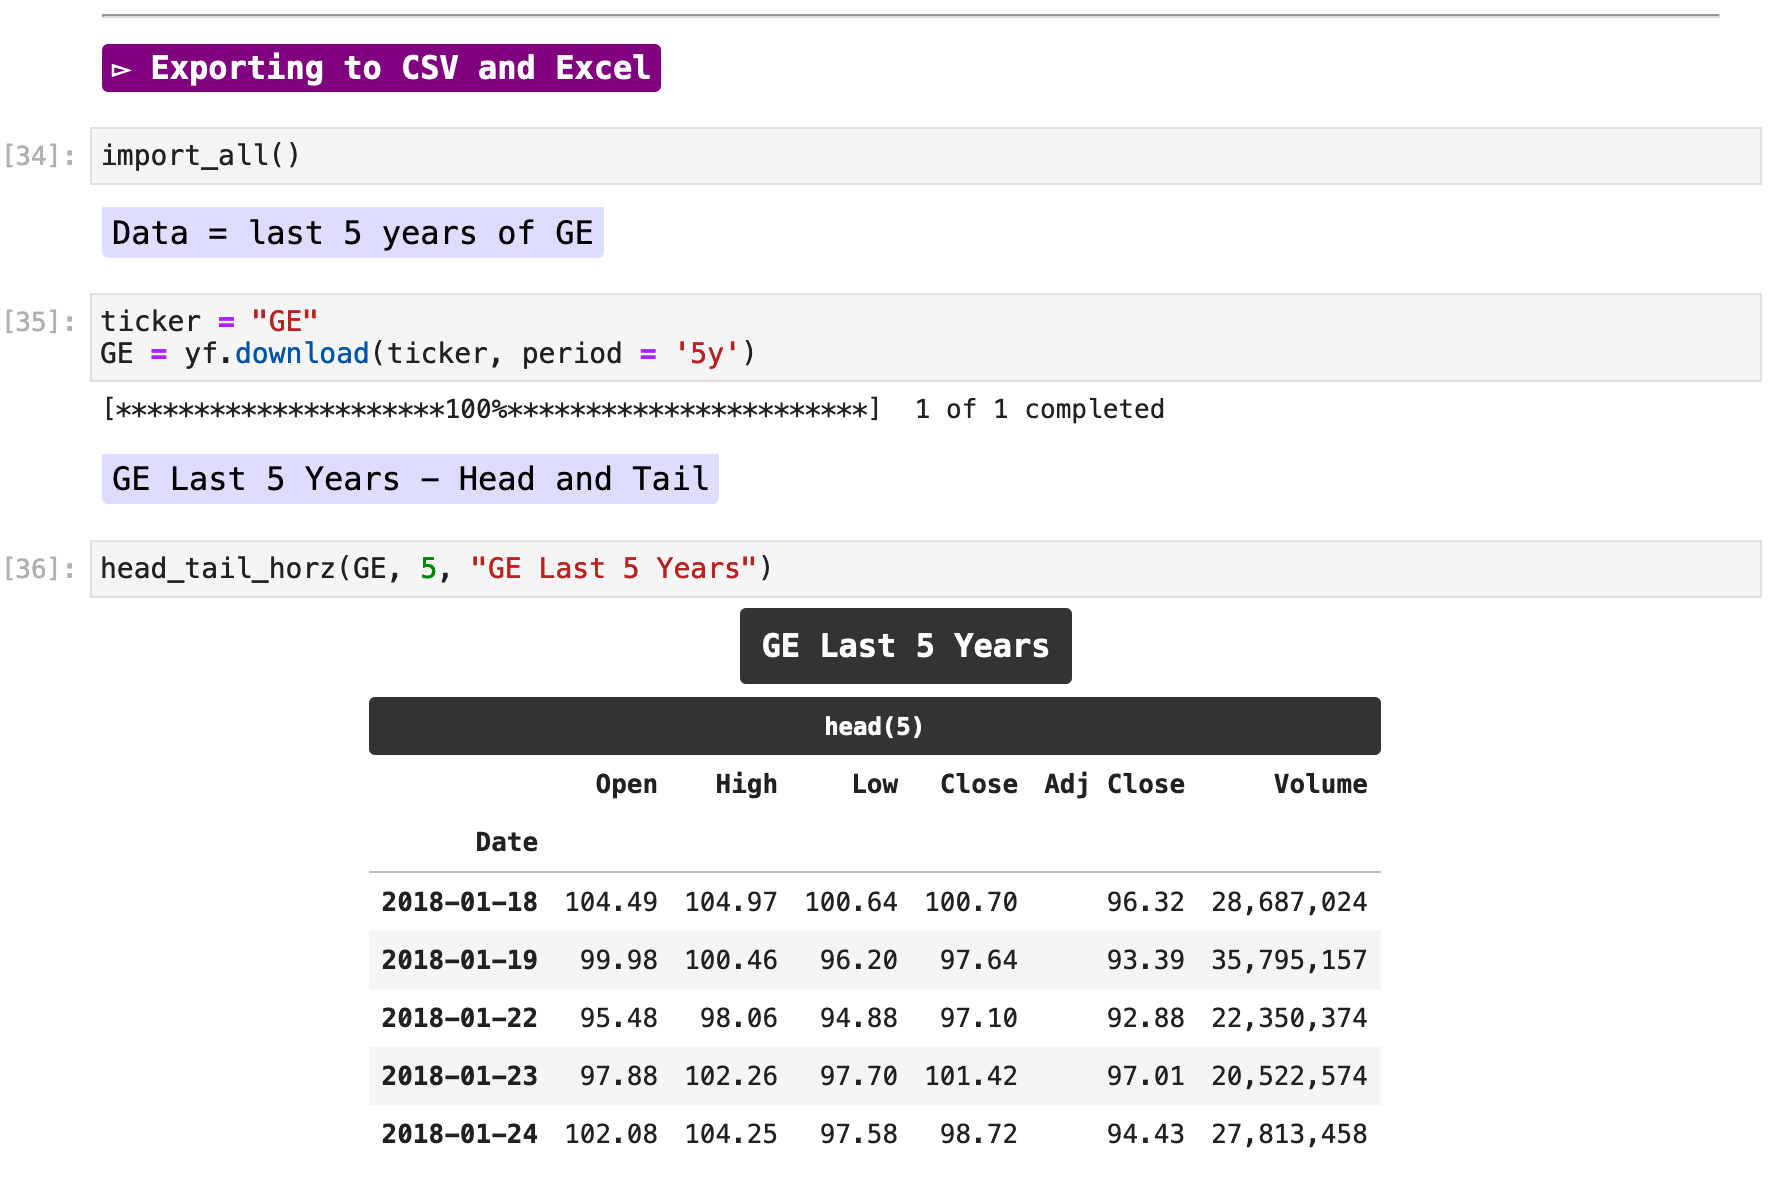
Exporting the data downloaded from Yahoo Finance is just a simple and easy as exporting any data with Pandas. Most commonly, we export to CSV, comma separated value, files with .to_csv(), which is incredibly convenient and also easy to re-import with .read_csv().
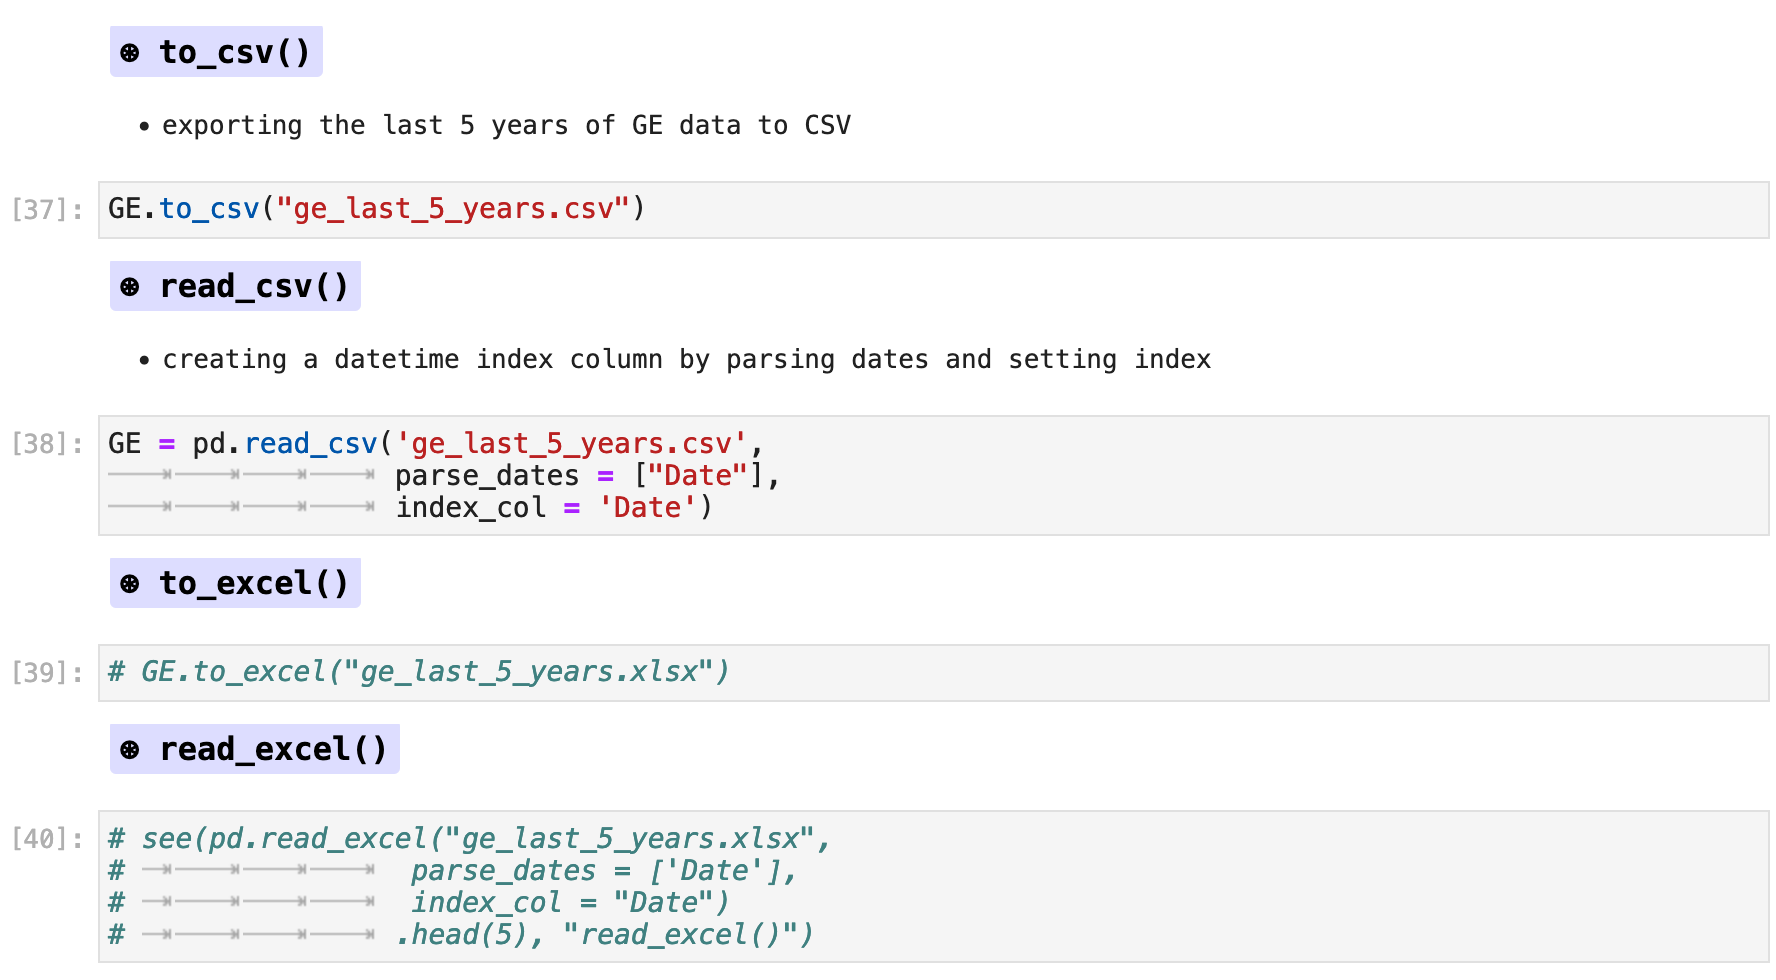
Pandas offers a wide variety of exporting formats in addition to CSV, such as excel format, sql, JSON, HTML, and much more. For more information on all these options, pleas visit the Pandas documentation here.

Sections: ● Top ● Historical Data ● Setting Date Range ● High Frenquency ● Splits & Dividends ● Exporting ● Multiple Stocks ● Importing Indexes ● Currency Exchange ● Cryptocurrencies ● Mutual & Exchange Traded Funds ● Treasury Yields ● Ticker Object & Docs ● Stock Fundamentals ● Importing Financials ● Importing Put & Call Options ● Streaming Real-Time ●

Downloading multiple stocks with yfinance is just as simple as downloading a single stock. The only difference is that instead of one ticker symbol, we must pass a list of ticker symbols. In the example below, I am using GE (General Electric), AAPL (Apple), and META (Facebook) ticker symbols. The result is a multi-indexed dataframe with all of the requested data for each stock ticker symbol.
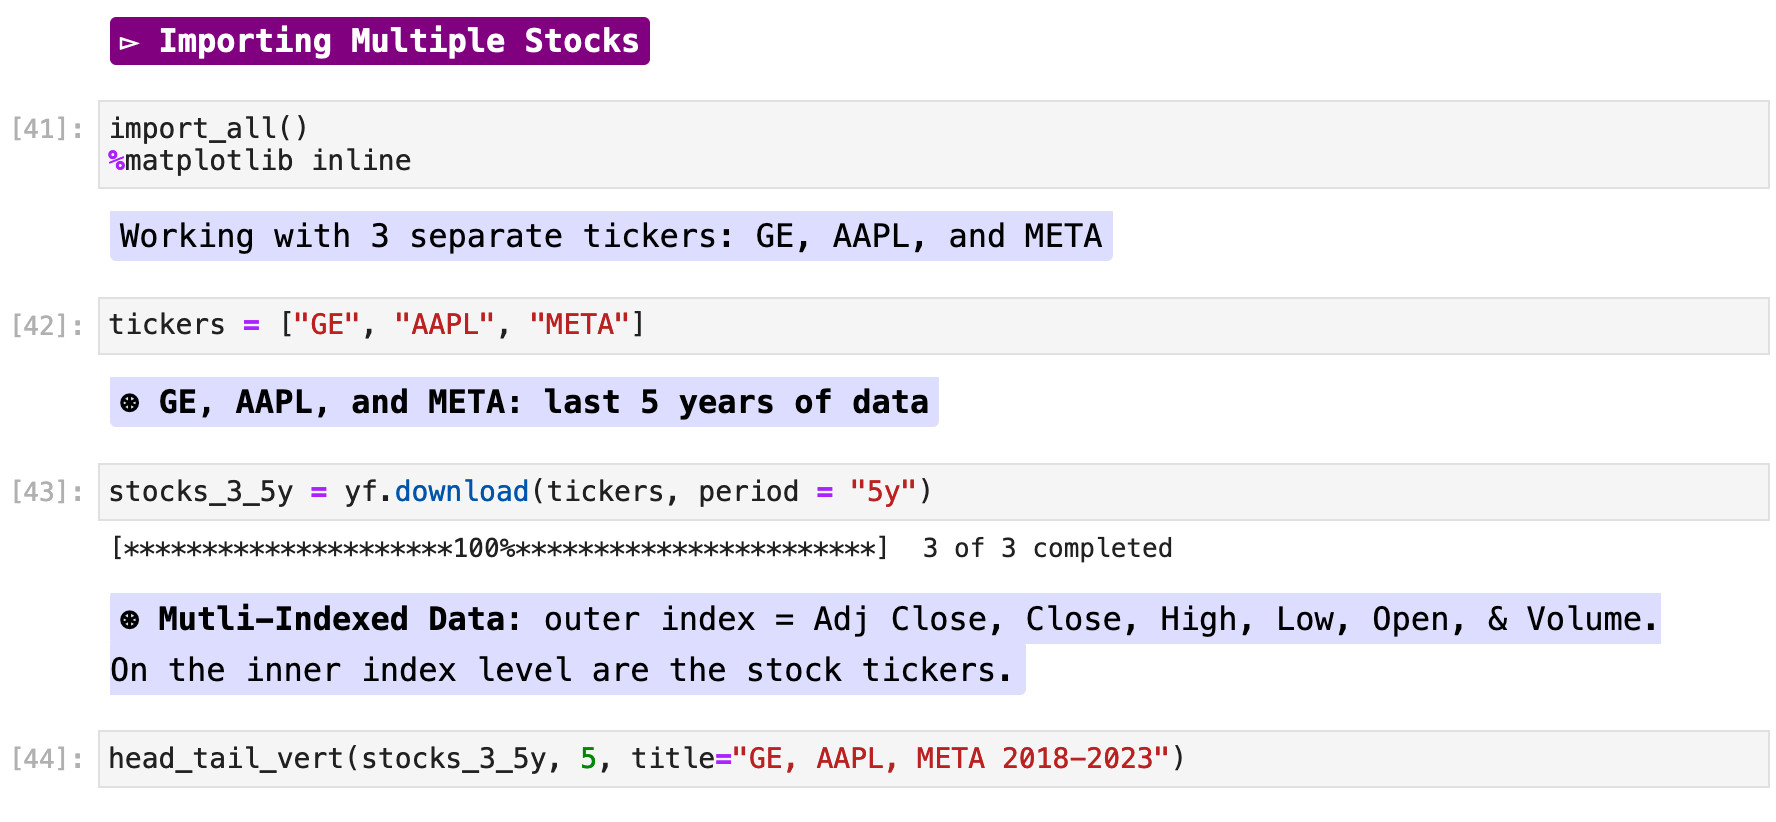
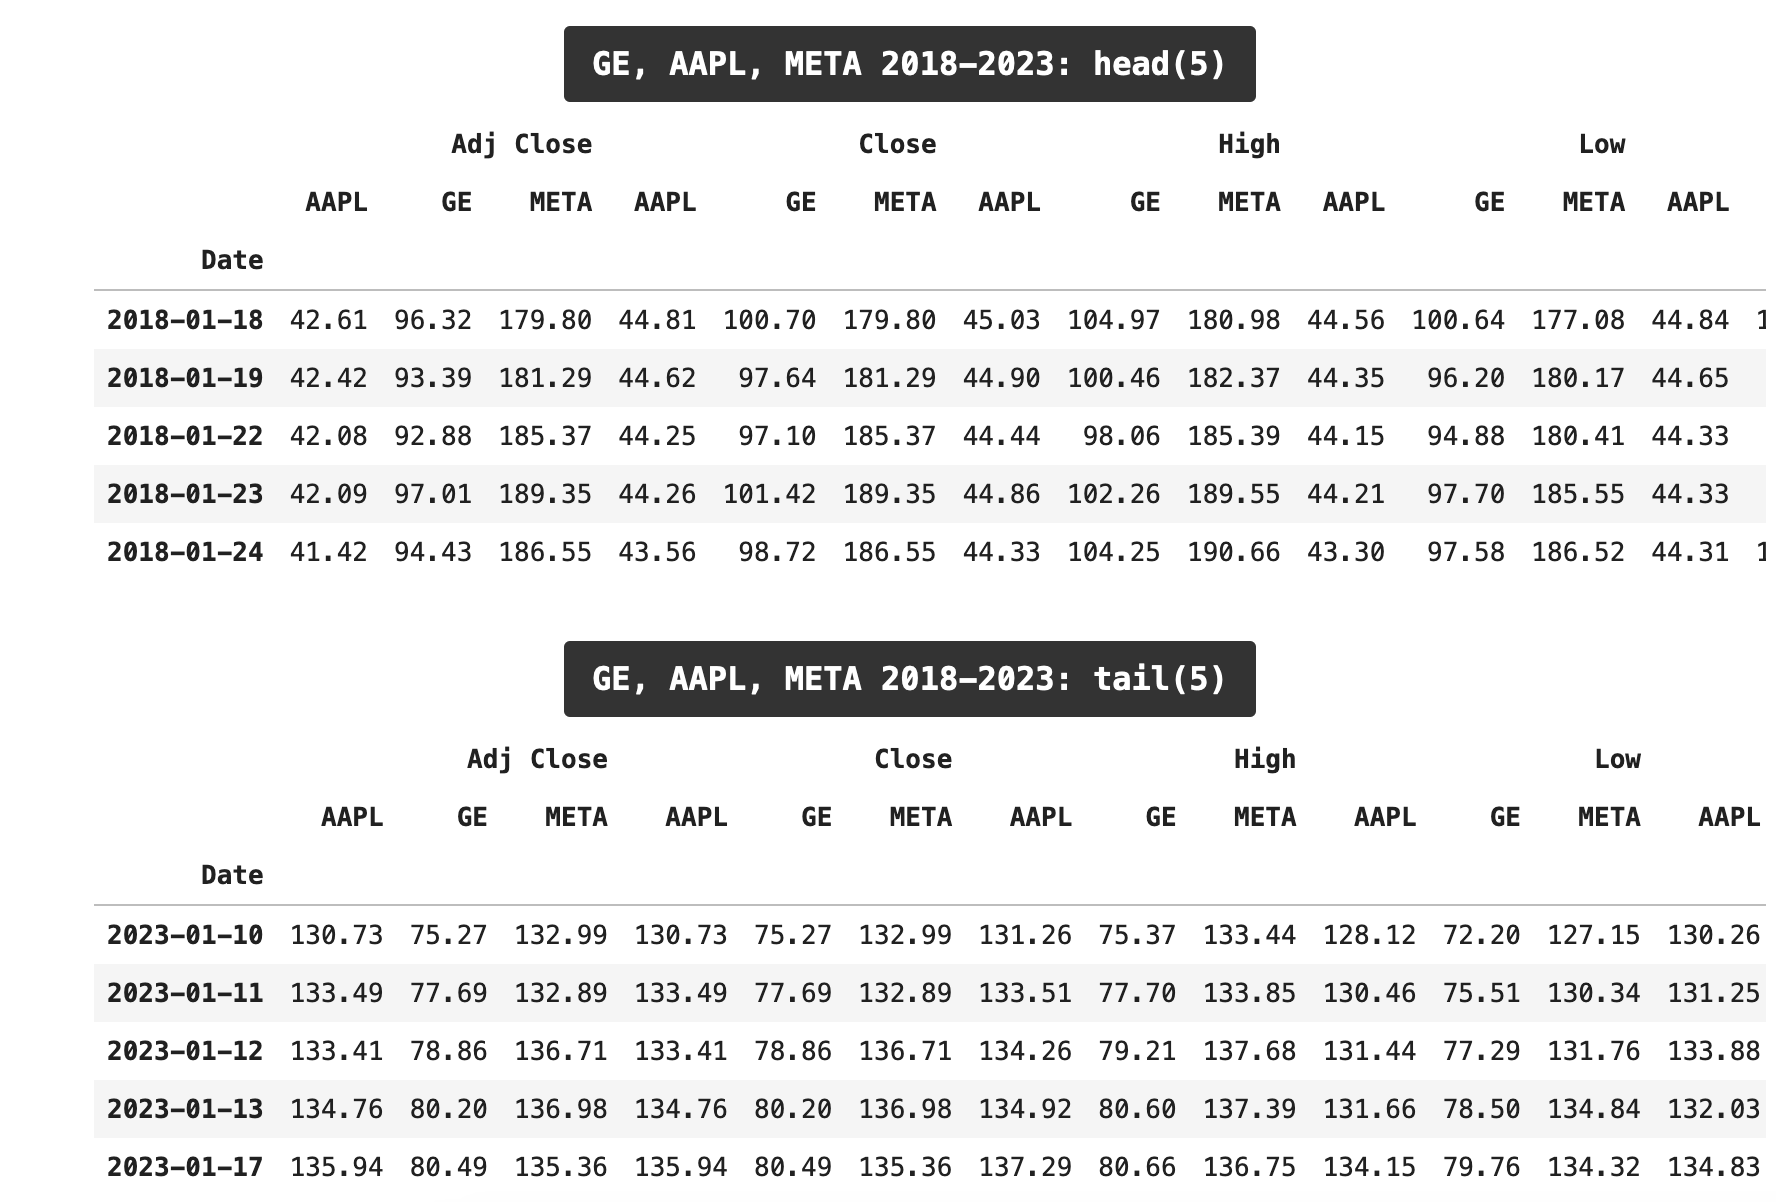
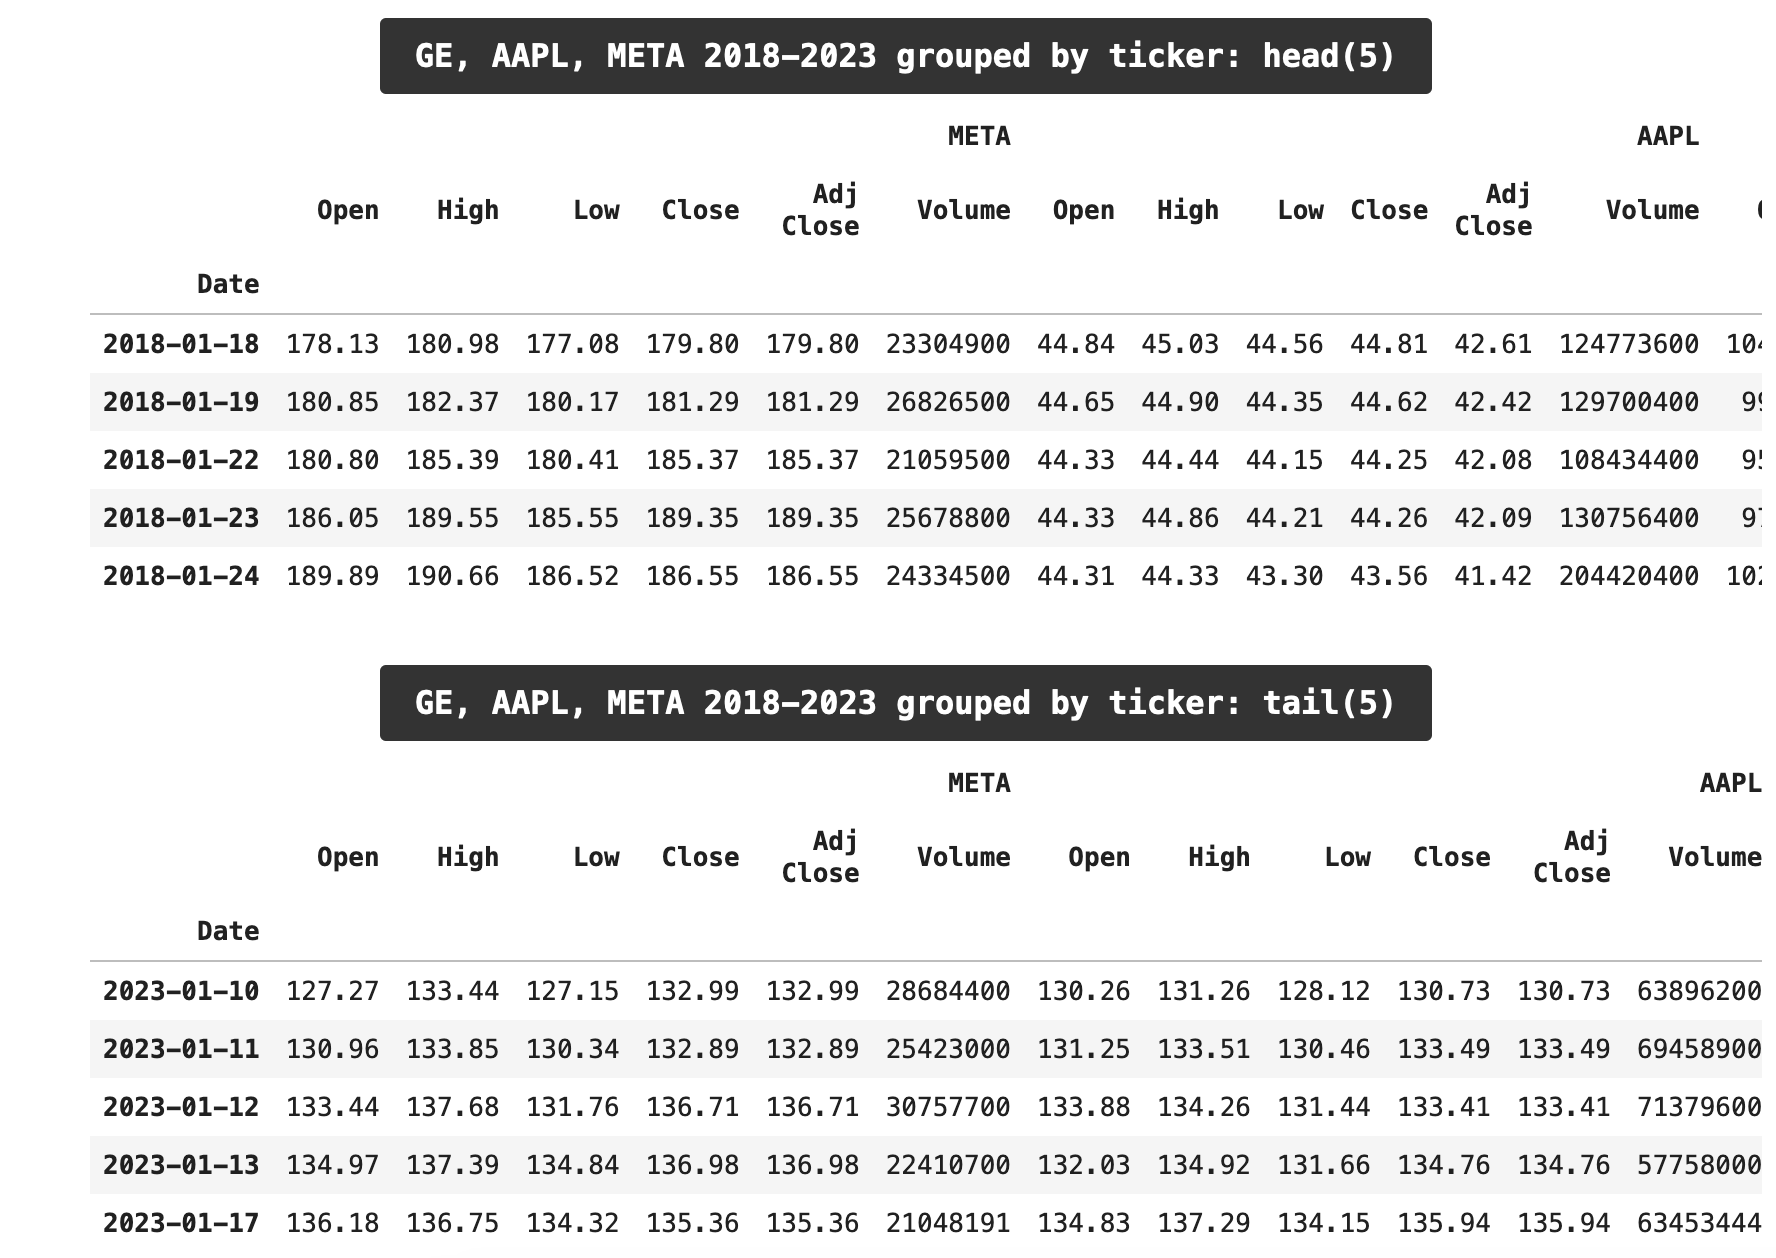
By default, the data will be grouped by common columns among the different ticker symbols. If we would rather have the data separated by ticker symbol, we can pass groupby=Ticker for the following configuration.

For observing the comparisons between the three stocks, we will retain only the Close column. Here we can see a plot with the three companies’ performance over the past 5 years along with a dataframe of samples from the overall dataframe organized chronologically, matching the plot. I find this format useful in gaining an deeper understanding of the data shown in the plot and the dataframe, as each complements the understanding of the other.
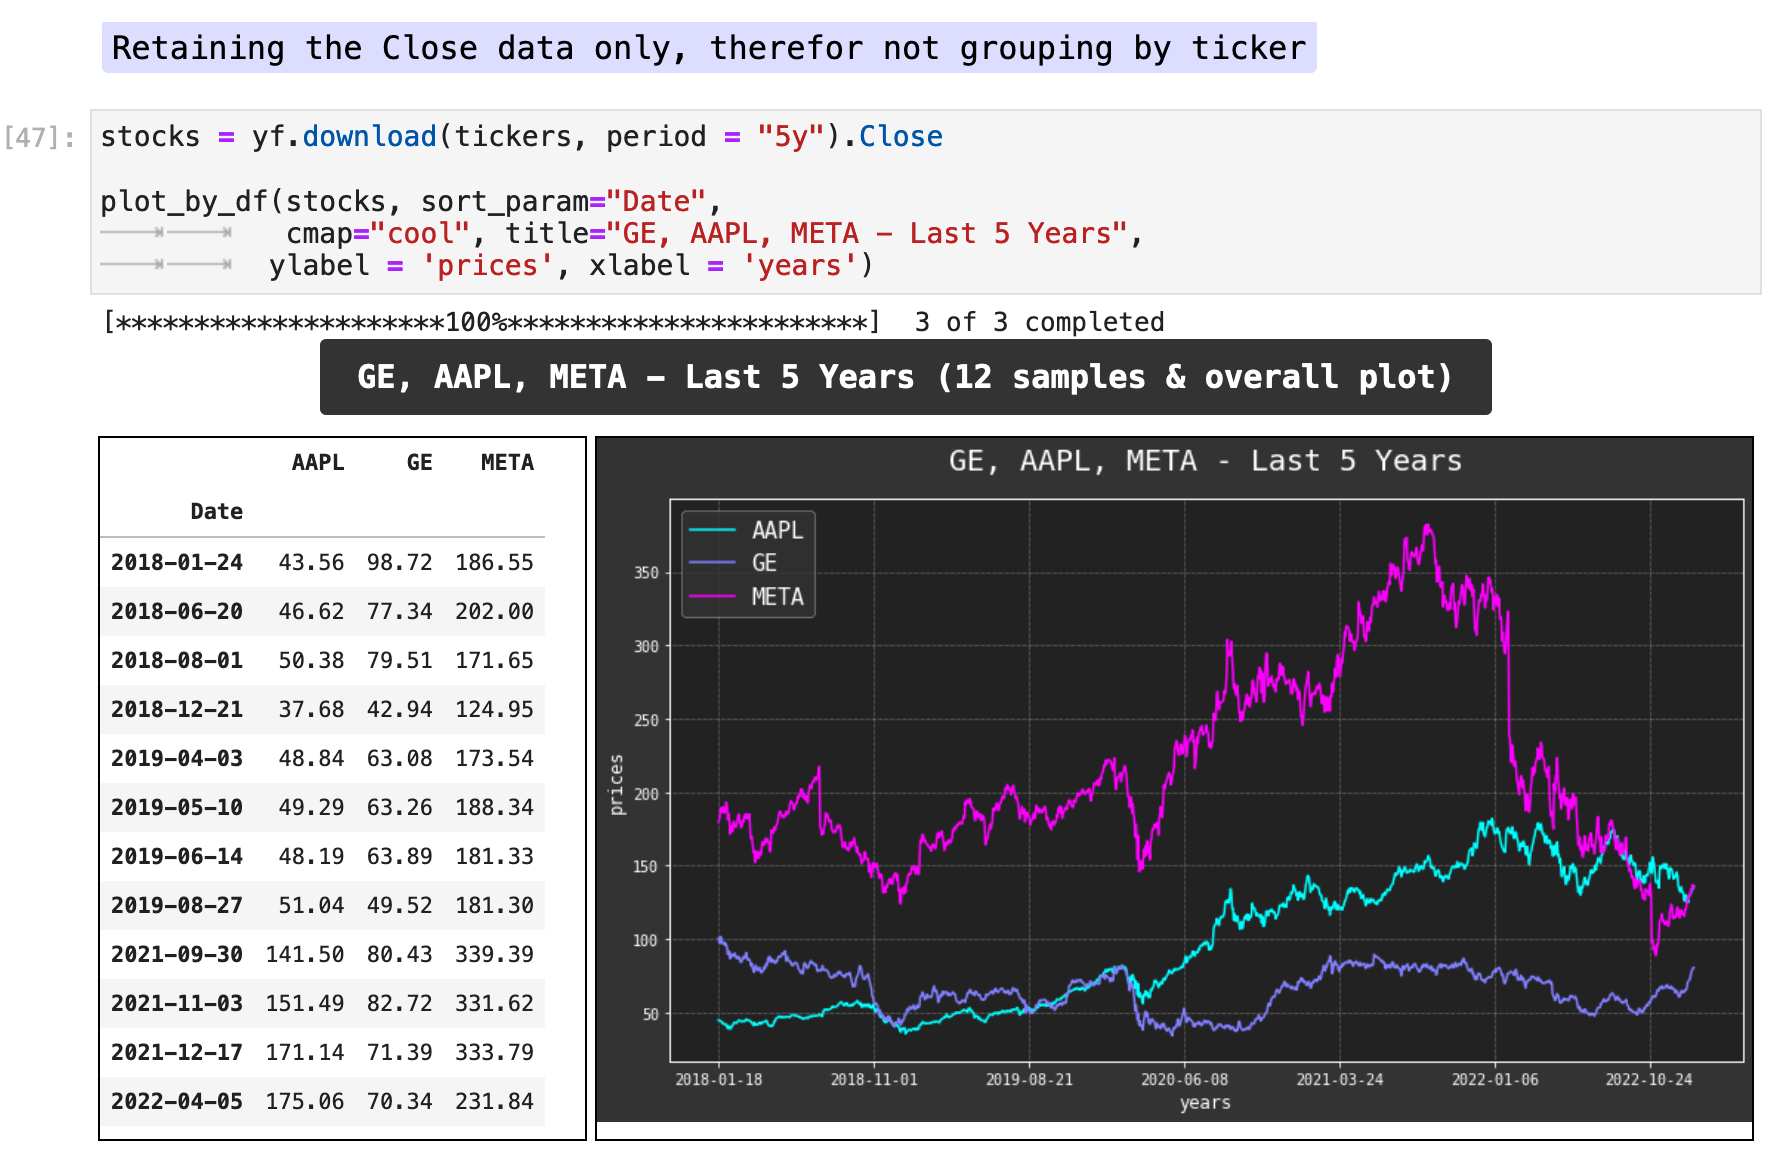
The following is the code for plot_by_df(), which I use to create the sample dataframe on the left and the plotted data from the same dataframe on the right.

Sections: ● Top ● Historical Data ● Setting Date Range ● High Frenquency ● Splits & Dividends ● Exporting ● Multiple Stocks ● Importing Indexes ● Currency Exchange ● Cryptocurrencies ● Mutual & Exchange Traded Funds ● Treasury Yields ● Ticker Object & Docs ● Stock Fundamentals ● Importing Financials ● Importing Put & Call Options ● Streaming Real-Time ●

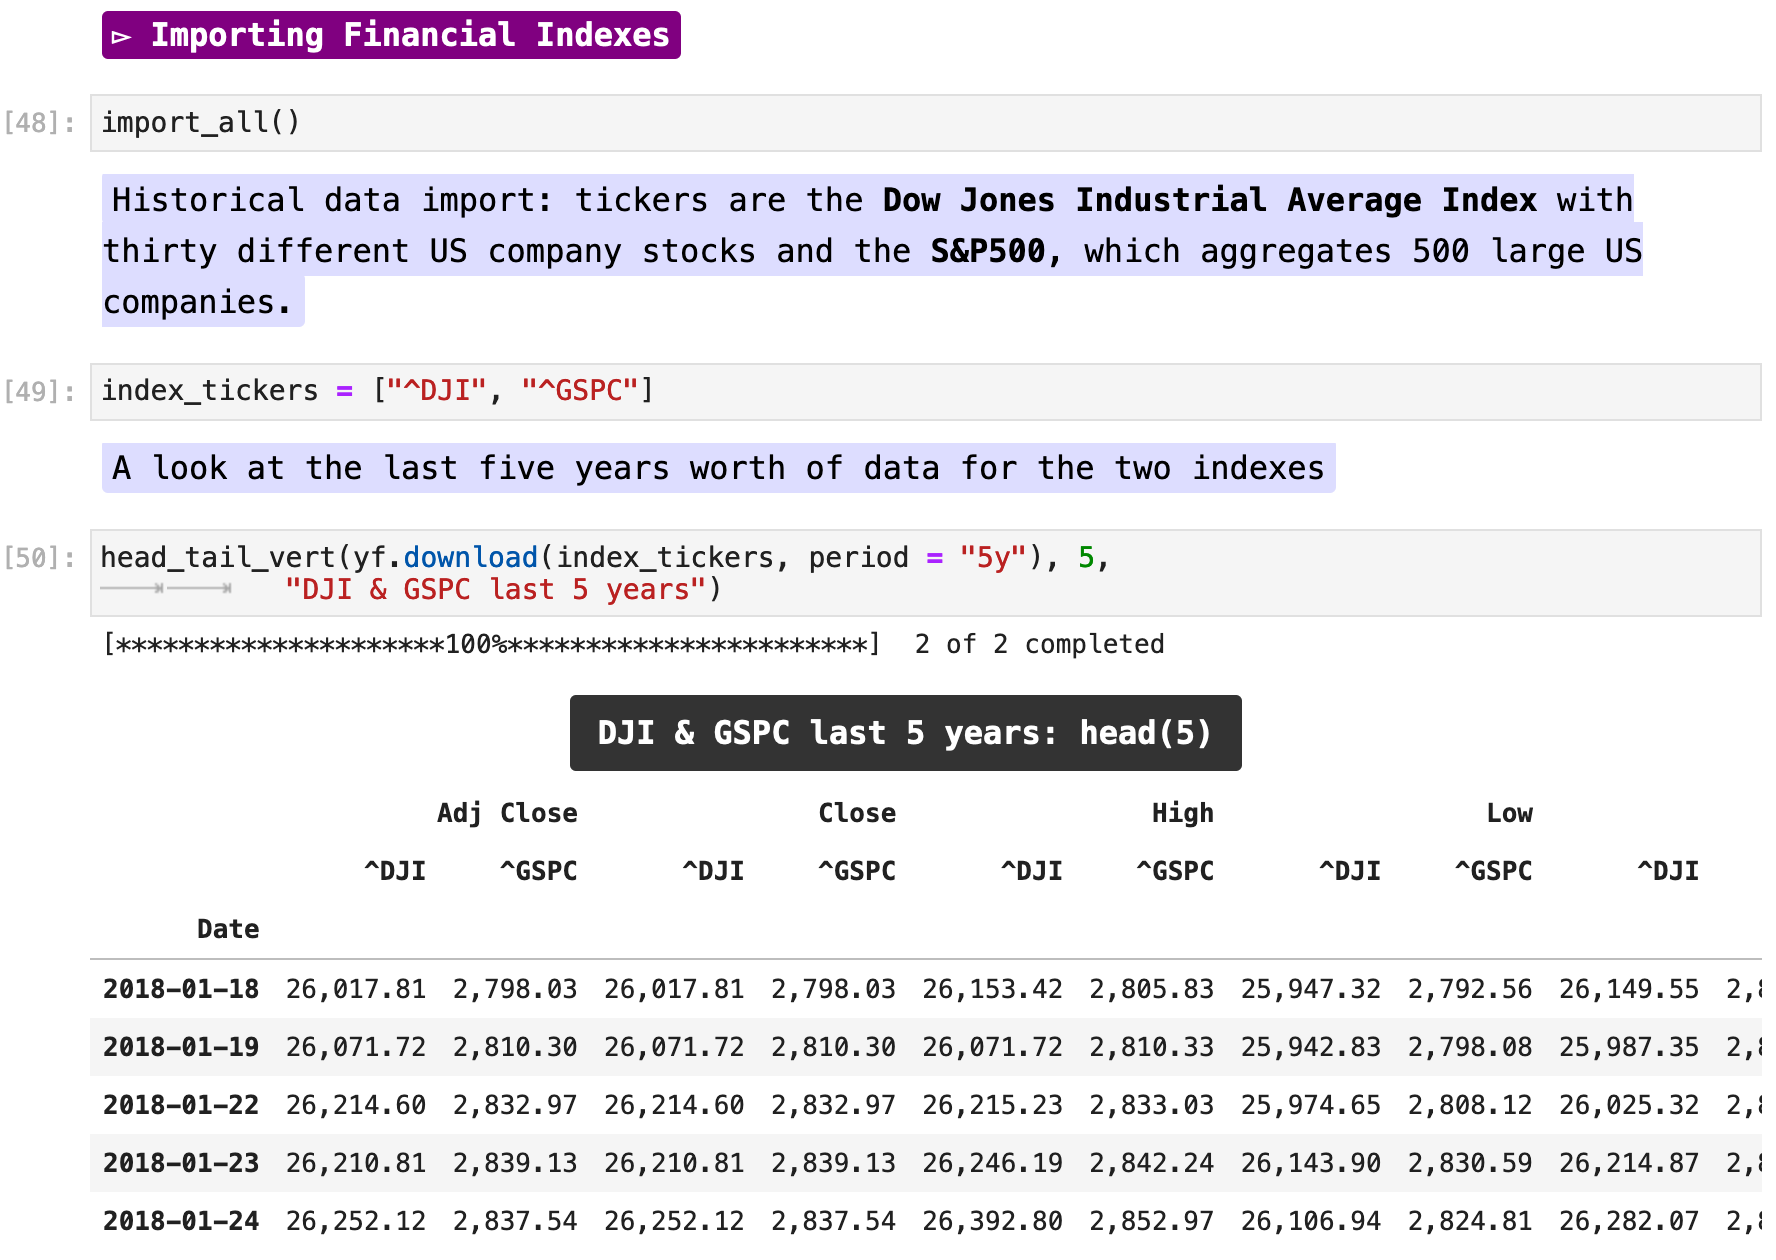
Importing indexes, such as the S&P 500 and the Dow Jones Industrial Average, are as simple as downloading tickers symbol individually or lists of ticker symbols. You know an index by the ^ symbol that precedes its name. Here I have made a list called index_tickers which includes the two above-mentioned indexes.
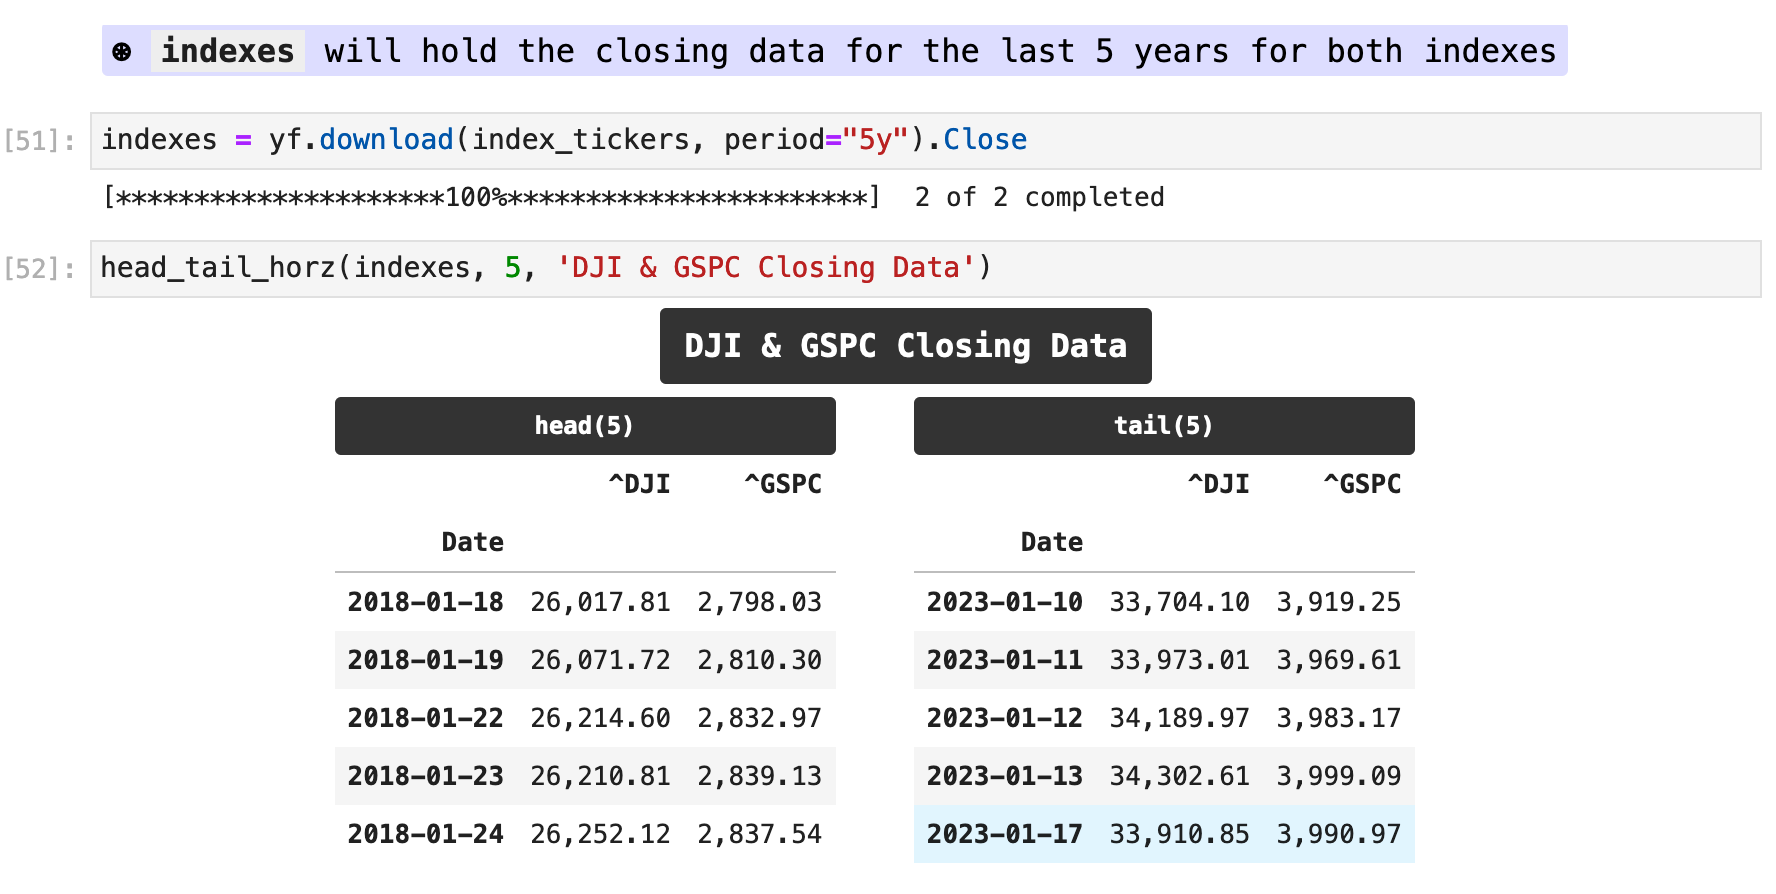
In the variable indexes I am storing the dataframe for the Dow Jones Industrial Average and S&P 500 for the past 5 years worth of data.
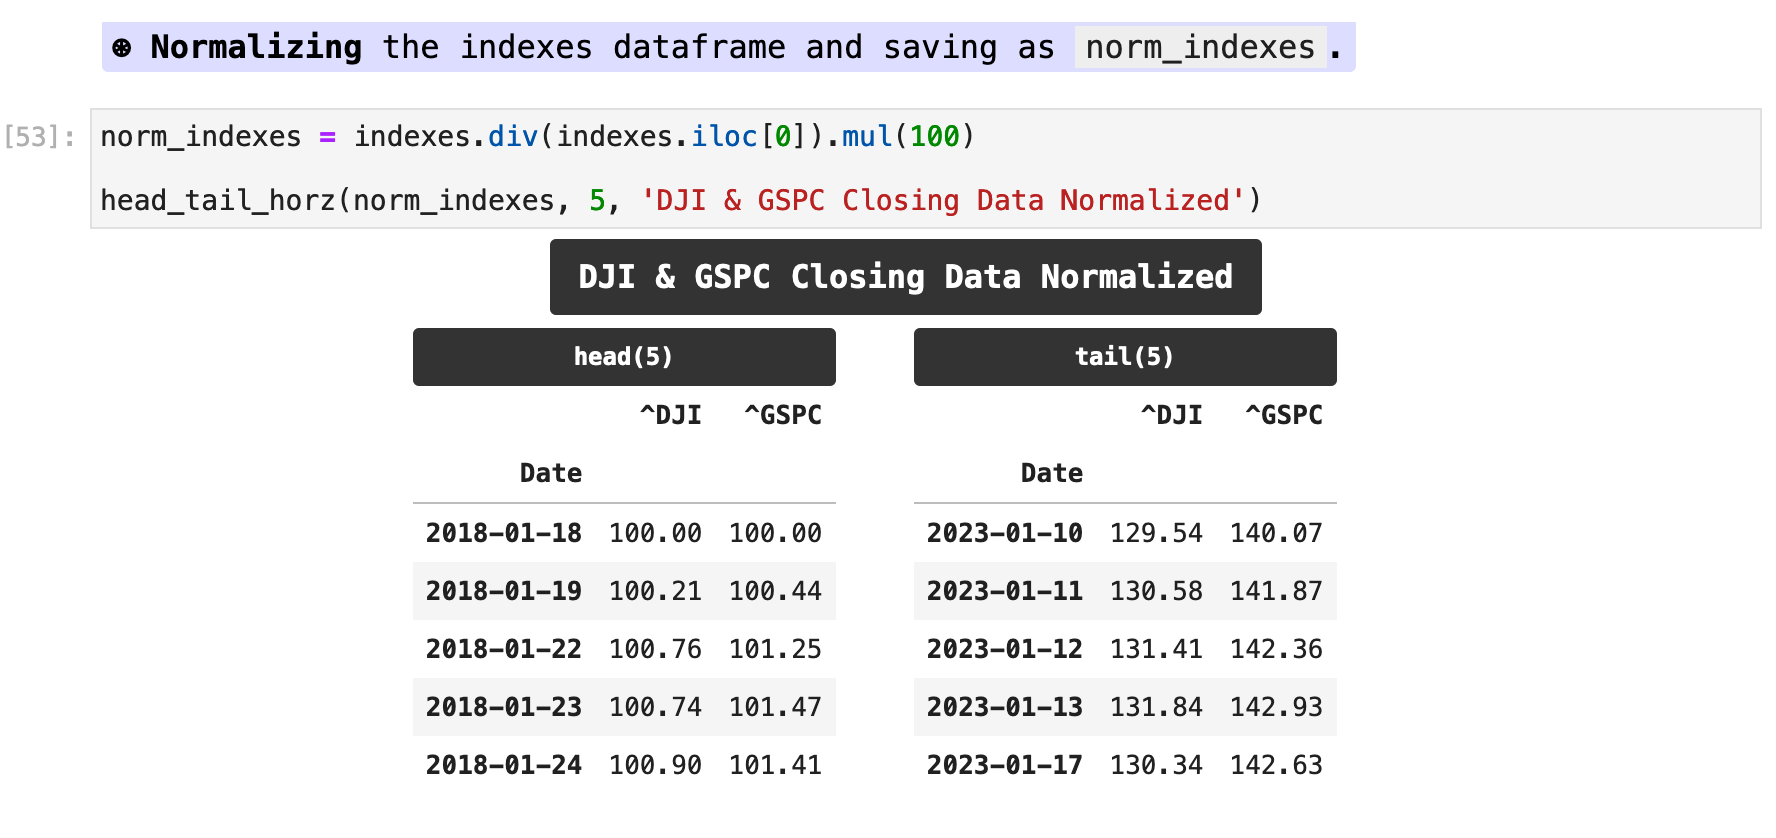
It is challenging to compare two indexes or stocks with one another when their prices are drastically different. So in order to make the comparison more meaningful, below I normalize the data so that both indexes begin at a price of 100. To do this, I divide every record’s values by the first record in the dataframe and then multiply by 100 for each, so we start at 100. We can then observe the indexes’ comparable changes from that point over the course of the date range passed. I save this data in a new variable called norm_indexes.
This is a visualization of the normalized performance of the two indexes compared.
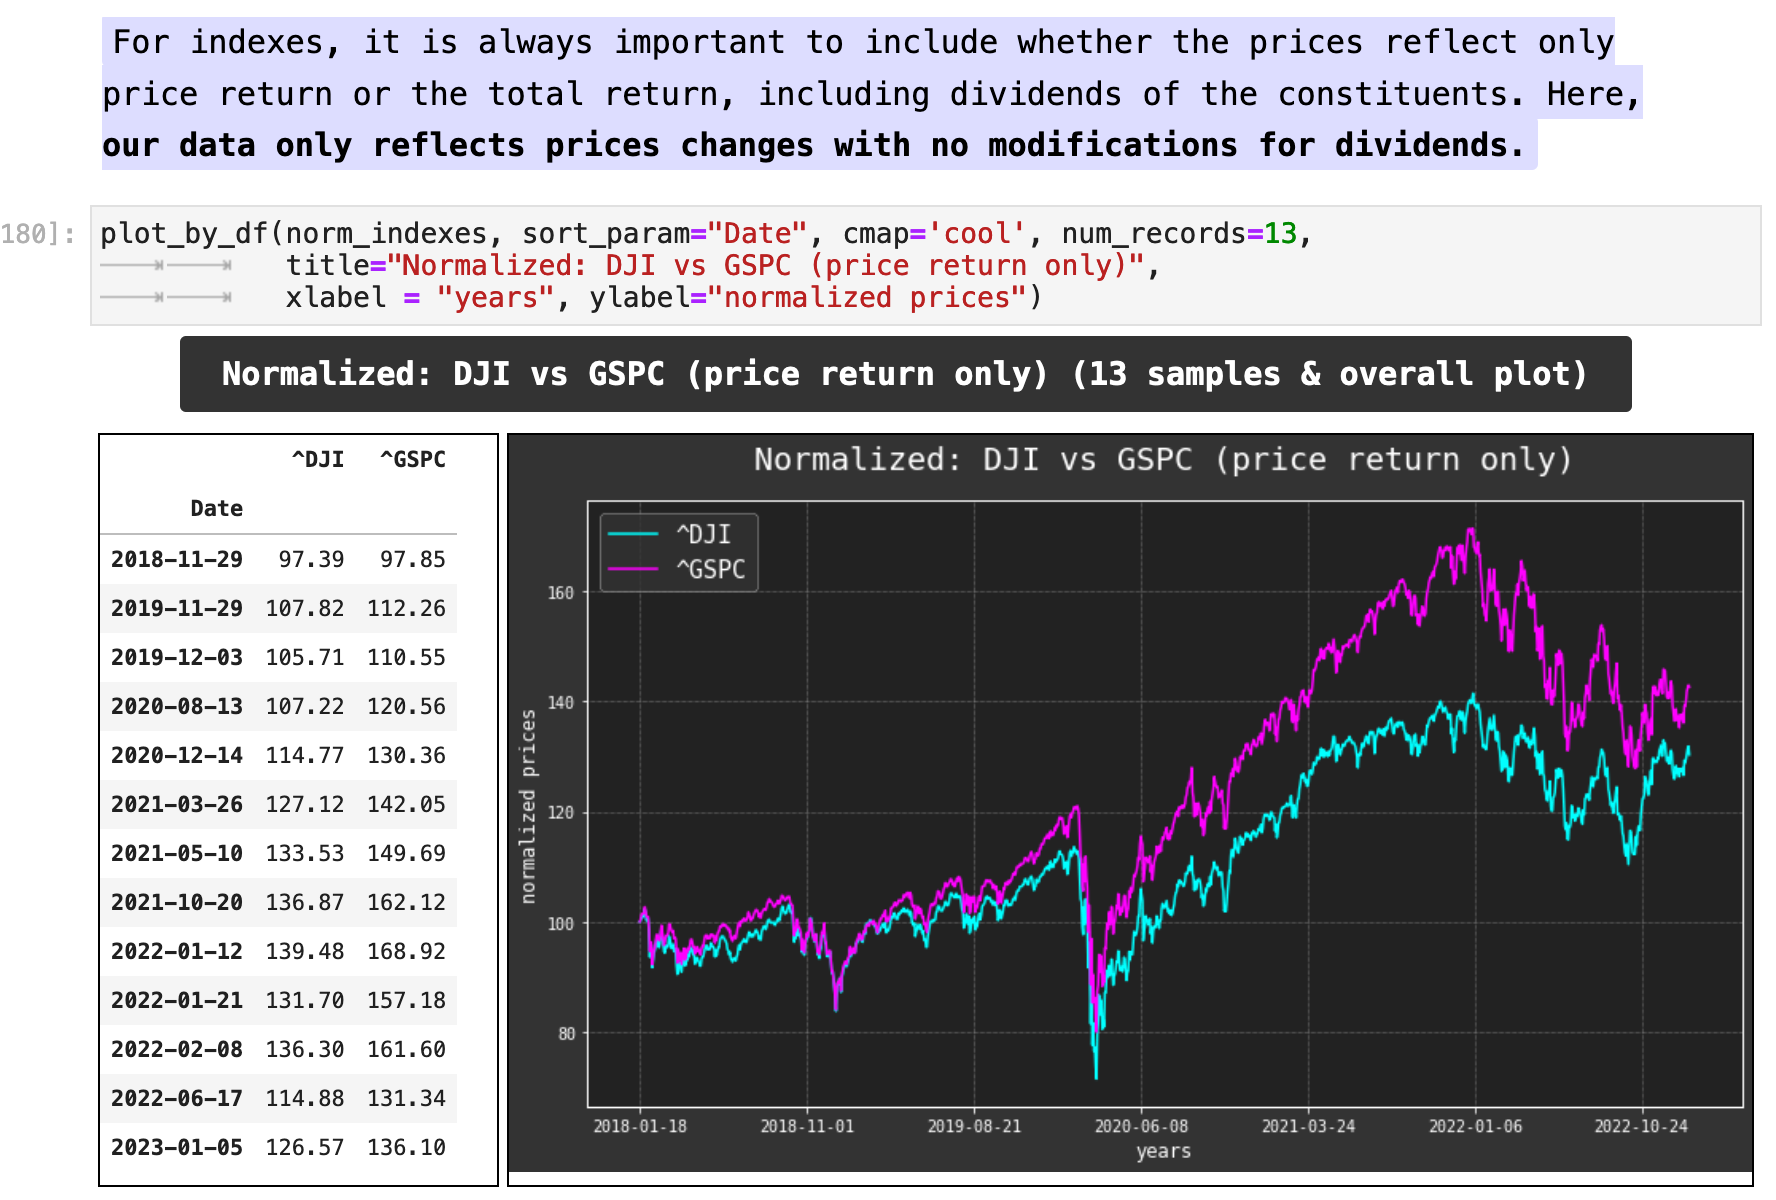
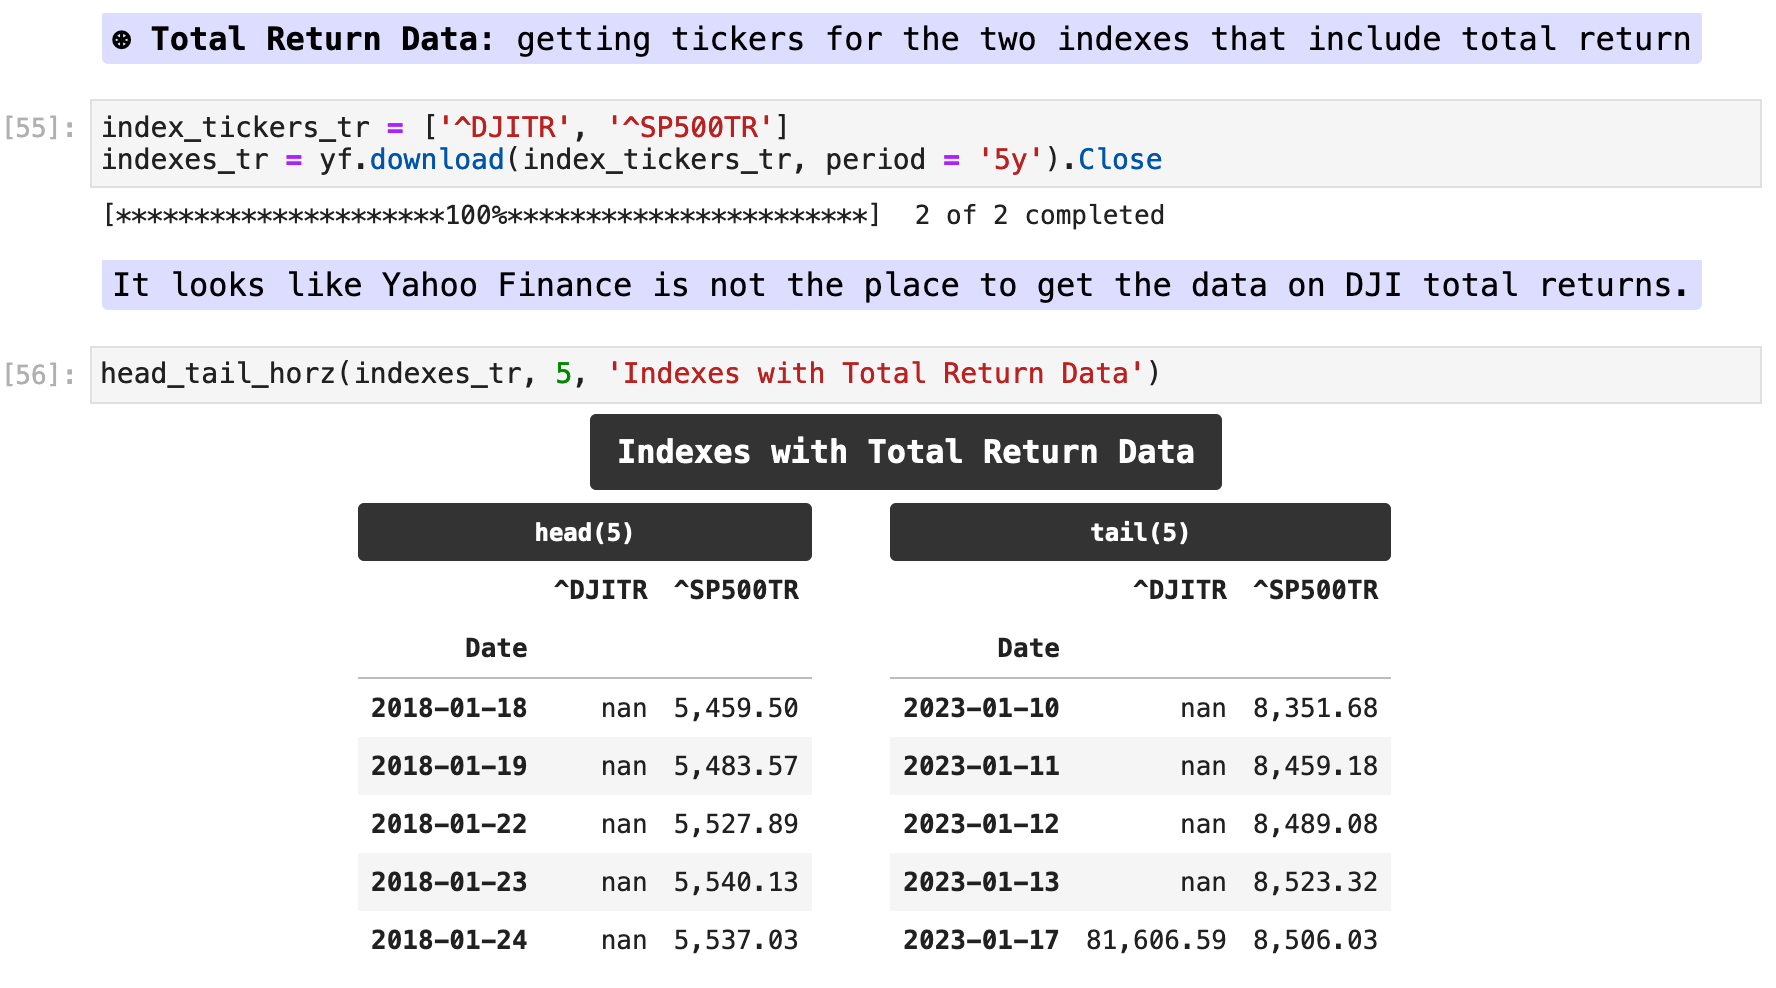
In order to get the total return data, including the dividends and stock splits reflected in the data, we must pass the total return version of the tickers to yf.download() and retrieve the total return data separately. These could also be downloaded in a list with the original two tickers.

Sections: ● Top ● Historical Data ● Setting Date Range ● High Frenquency ● Splits & Dividends ● Exporting ● Multiple Stocks ● Importing Indexes ● Currency Exchange ● Cryptocurrencies ● Mutual & Exchange Traded Funds ● Treasury Yields ● Ticker Object & Docs ● Stock Fundamentals ● Importing Financials ● Importing Put & Call Options ● Streaming Real-Time ●

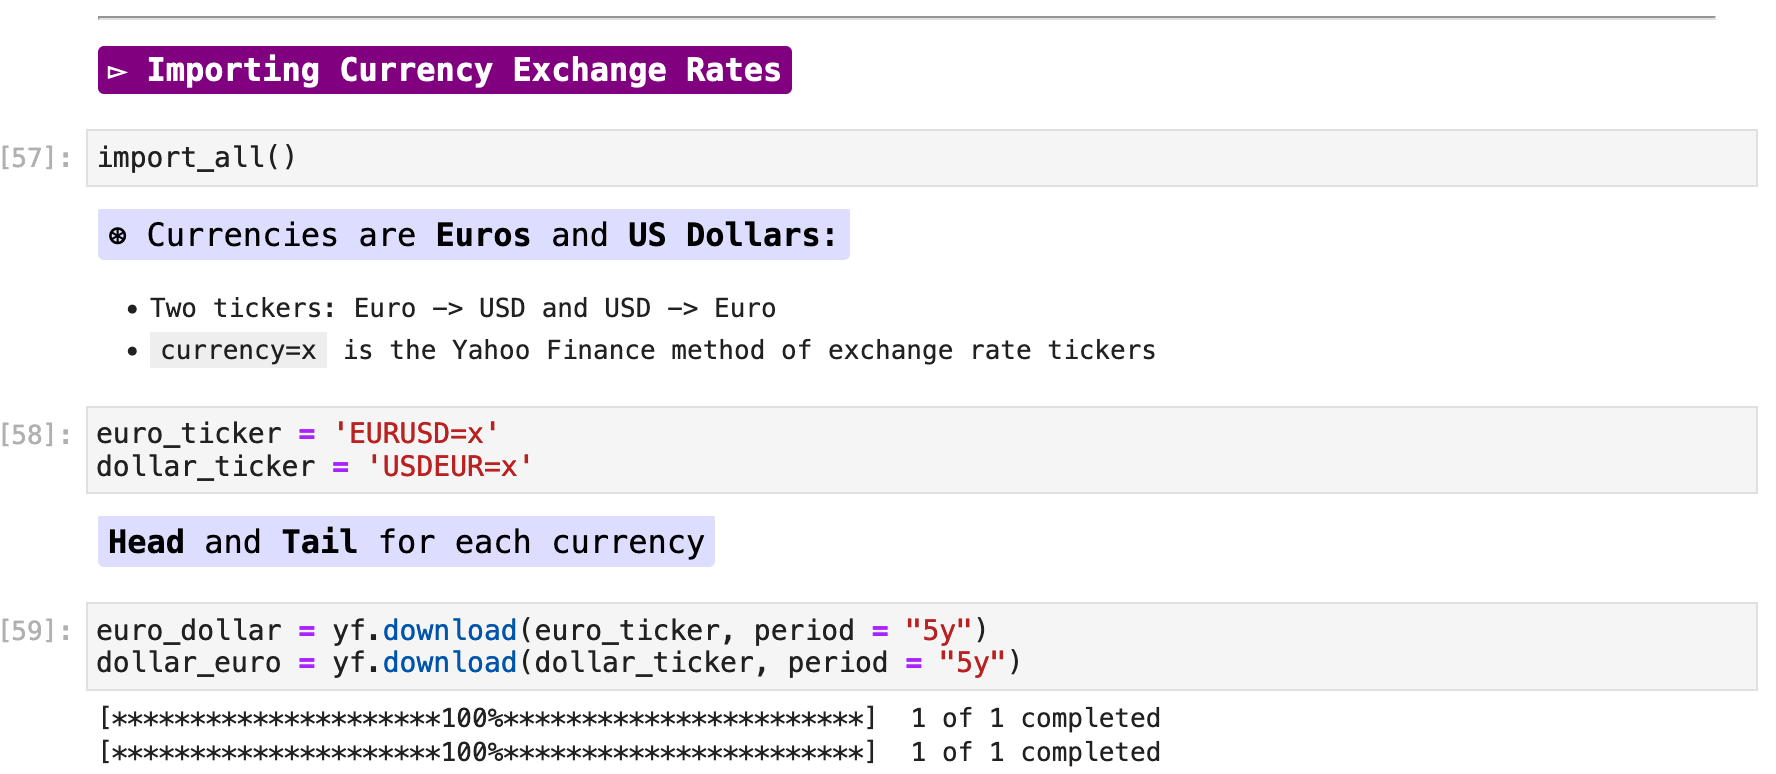
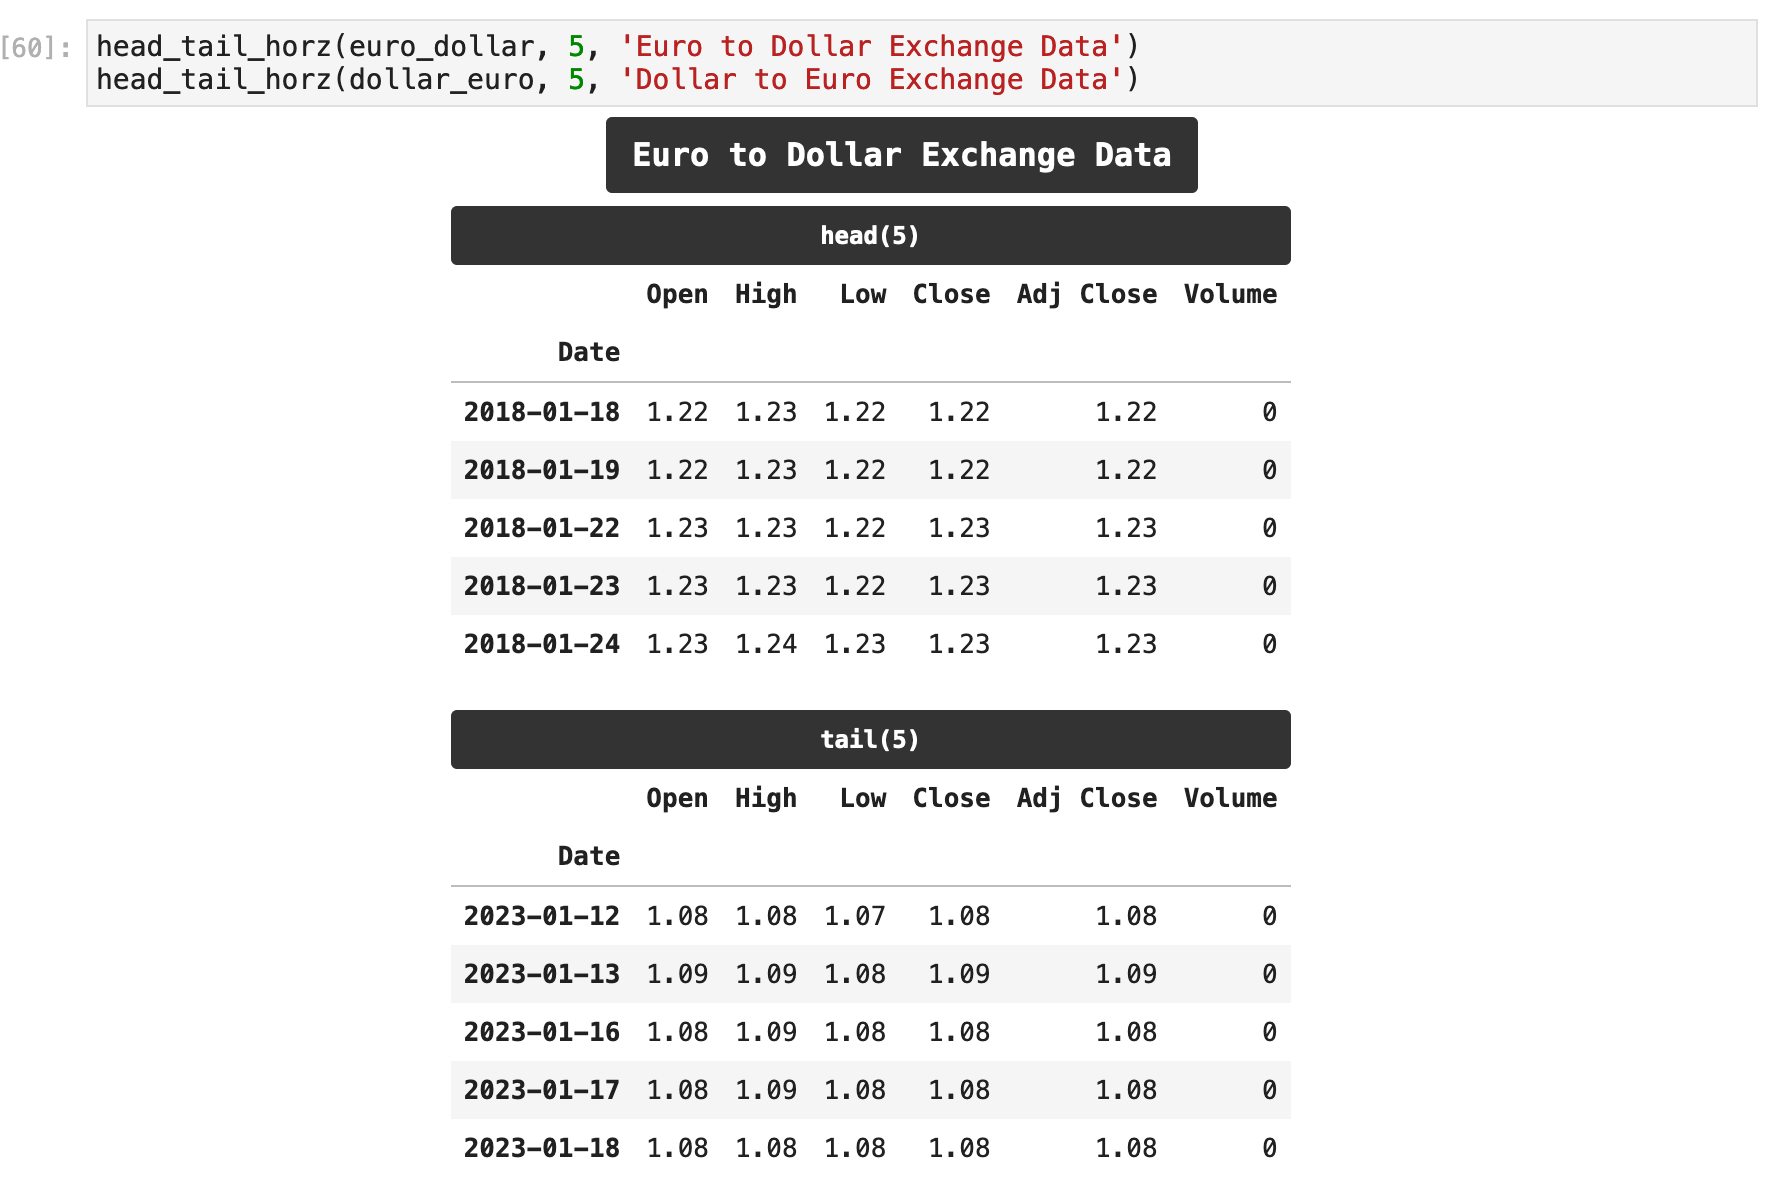
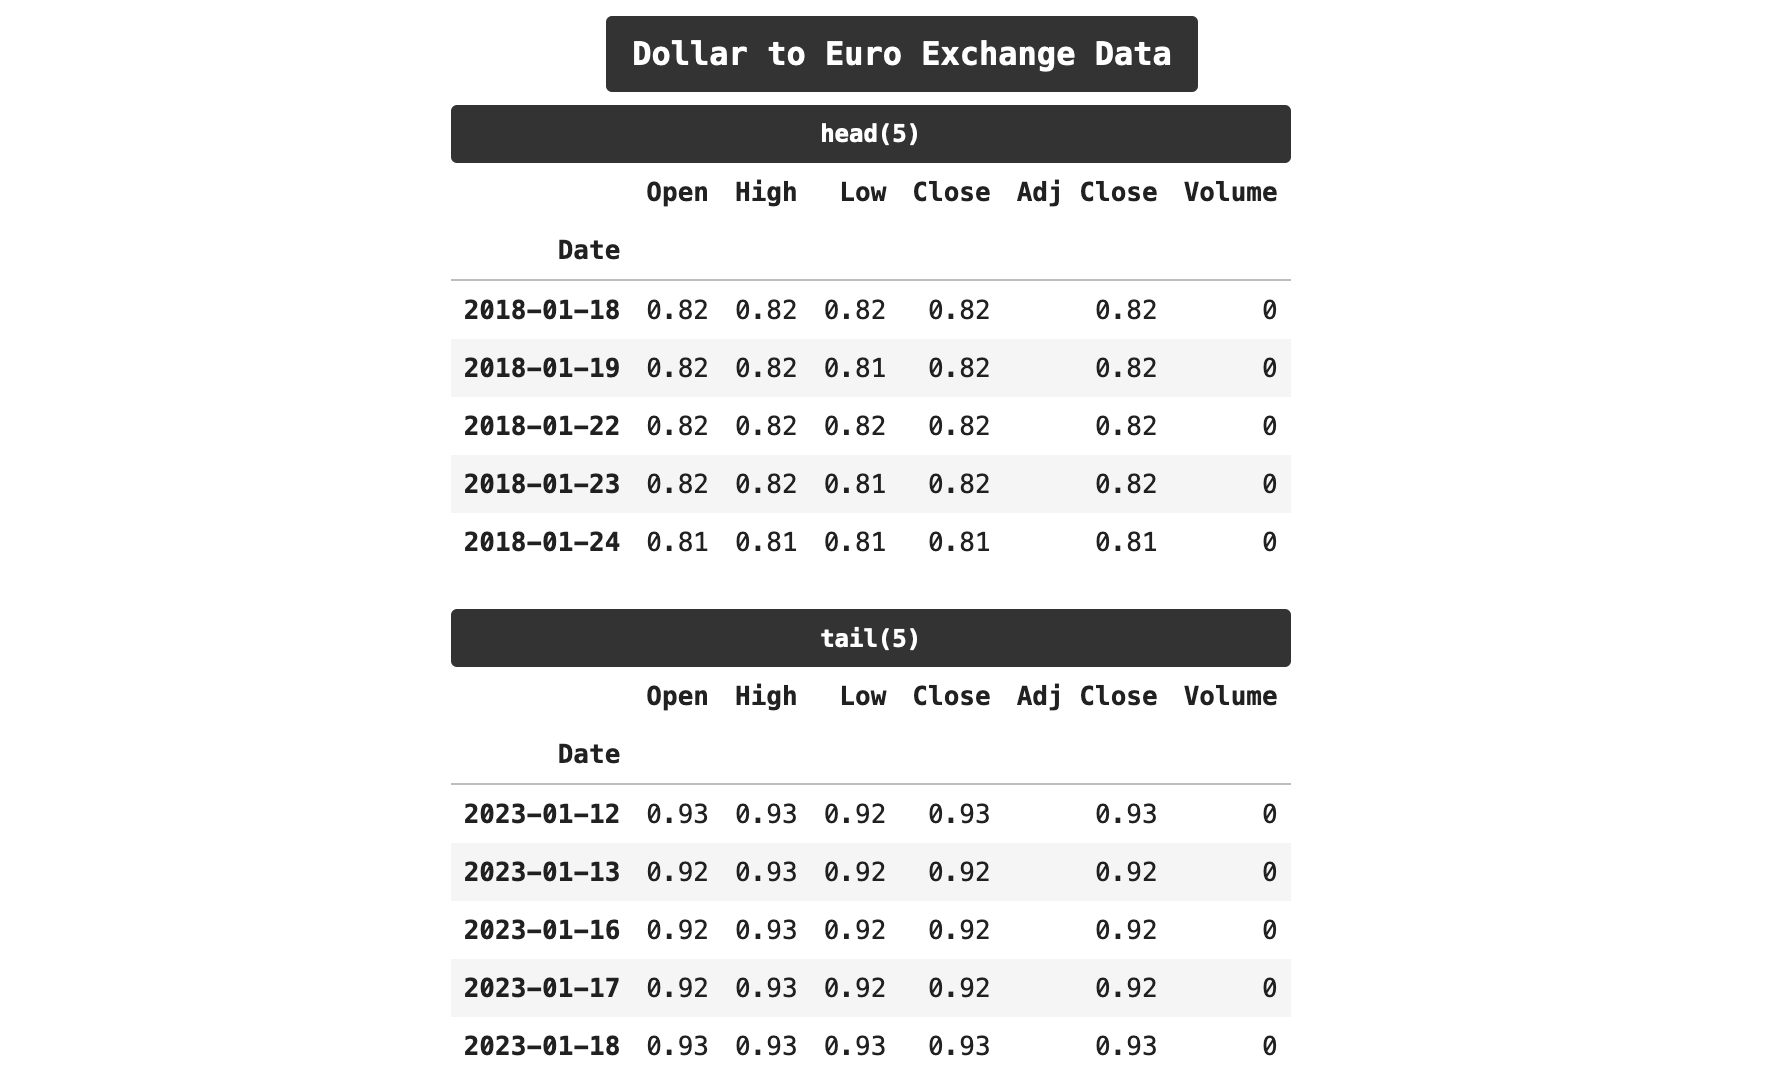
Another wealth of data that Yahoo Finance offers is that of currency exchanges. The tickers for these records are generally formatted with currency_one + currency_two =x. Here we are investigating the exchanges from Euro to US Dollar and from US Dollar to Euro.
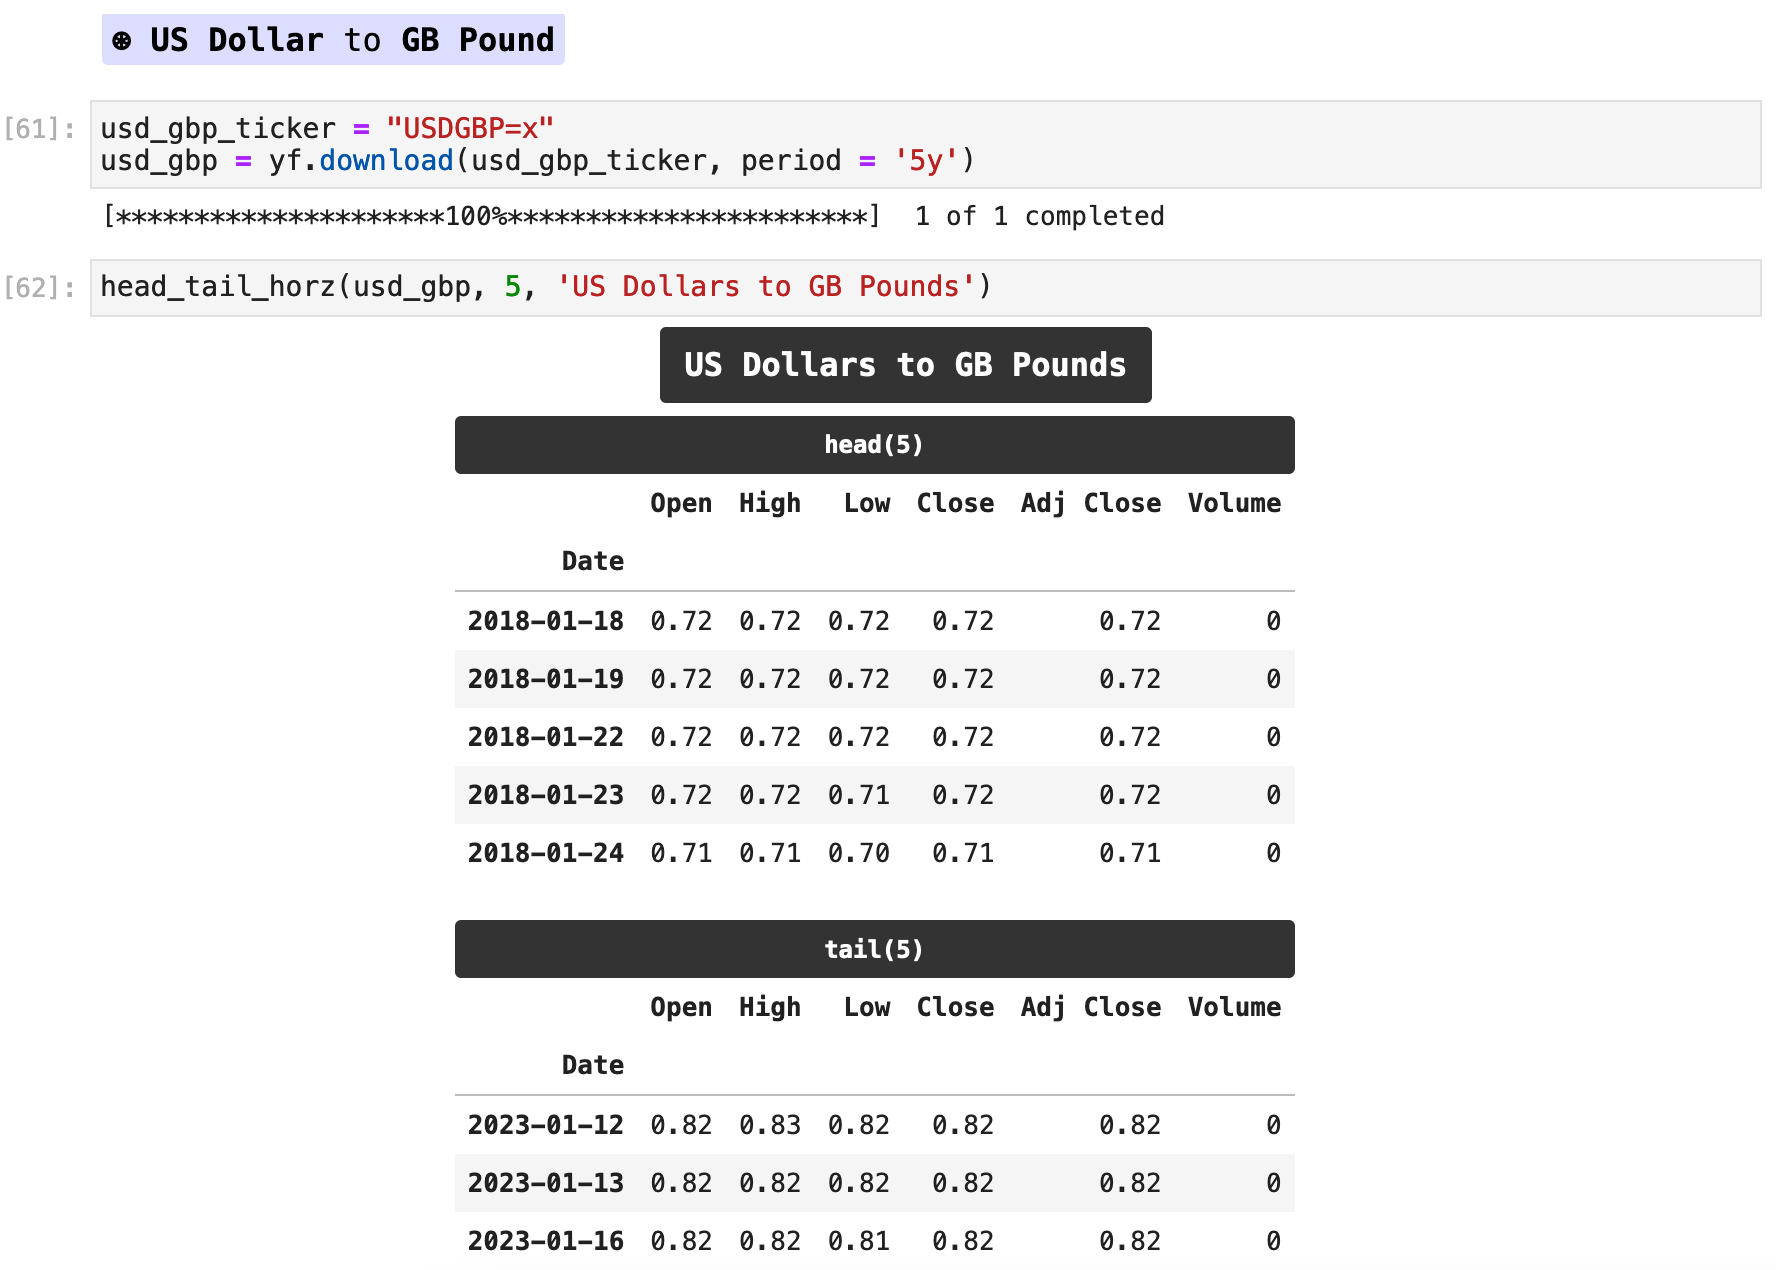
We can likewise get the data for just about any currency exchanged on the market. Here is another example, this time the US Dollar to Pound Sterling exchange.

Sections: ● Top ● Historical Data ● Setting Date Range ● High Frenquency ● Splits & Dividends ● Exporting ● Multiple Stocks ● Importing Indexes ● Currency Exchange ● Cryptocurrencies ● Mutual & Exchange Traded Funds ● Treasury Yields ● Ticker Object & Docs ● Stock Fundamentals ● Importing Financials ● Importing Put & Call Options ● Streaming Real-Time ●

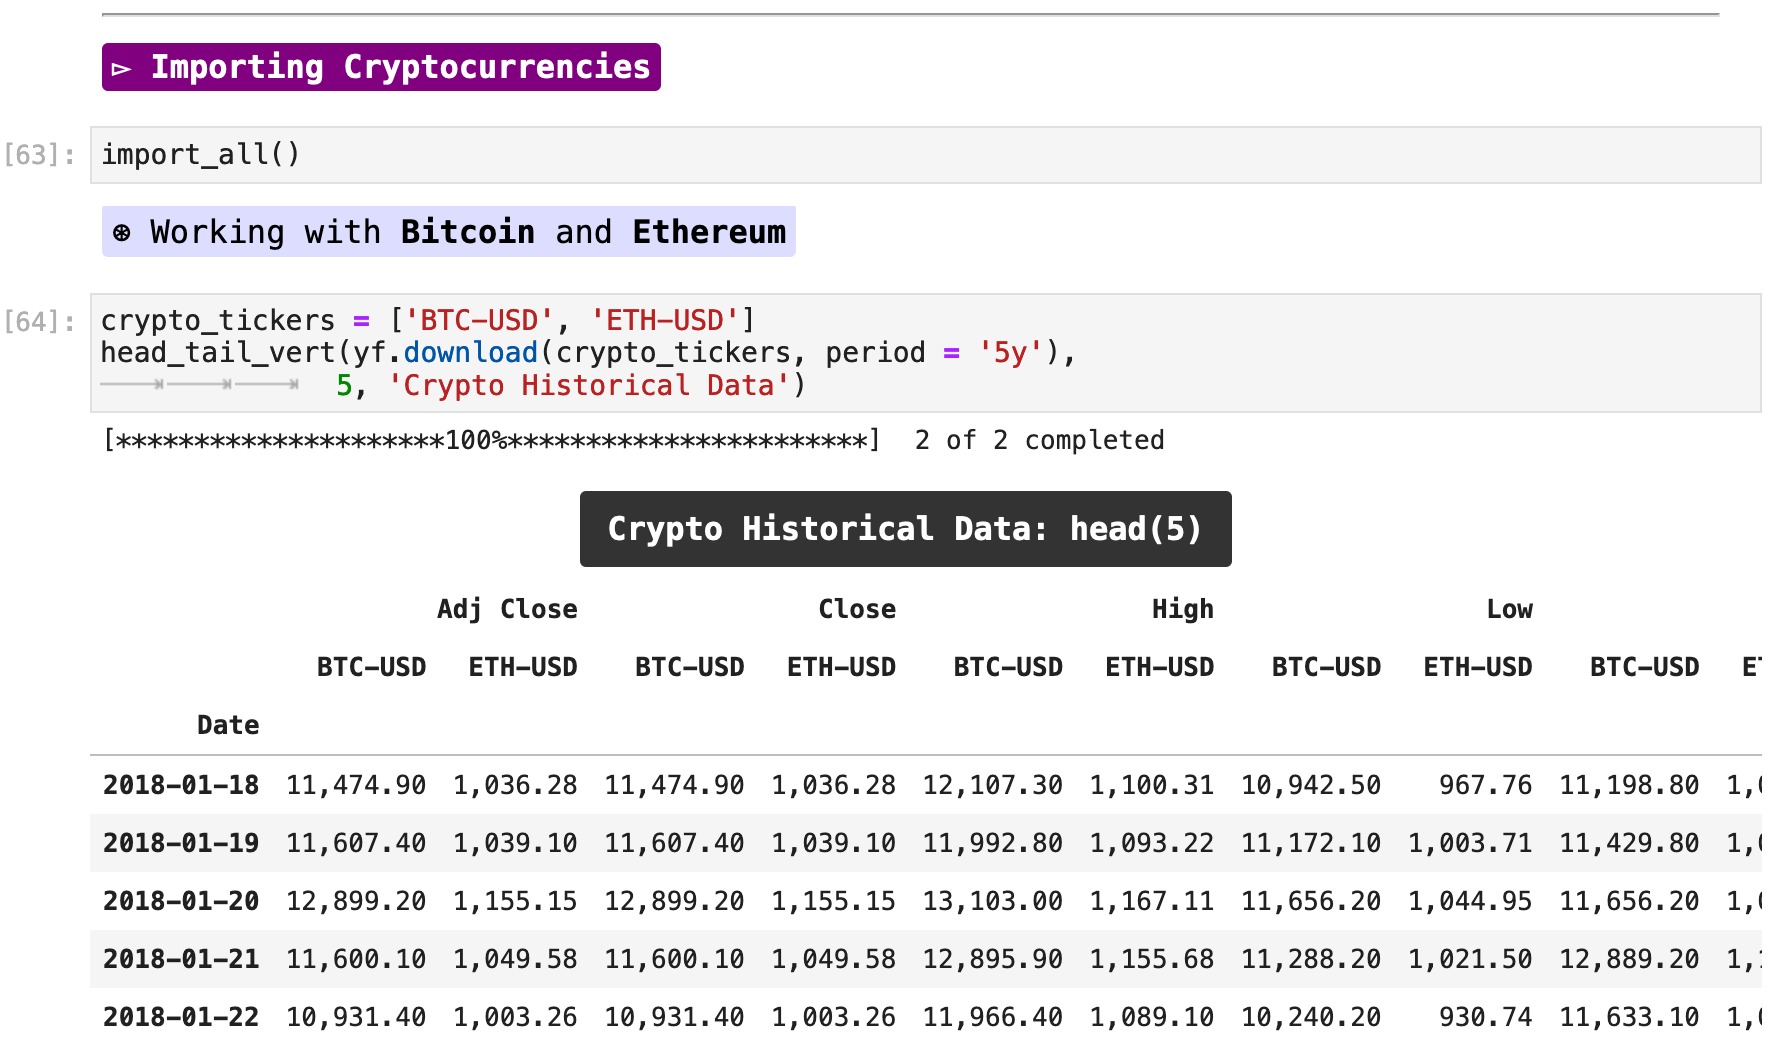
Cryptocurrencies have become incredibly popular over the past few years, and in spite of their recent roller coaster rides on the market, they are once again becoming one of the hottest trade items. With Yahoo Finance, we can also get a wealth of data on many different forms of cryptocurrency. Below, I am retrieving data for two of the most popular cryptocurrencies, Bitcoin and Ethereum.
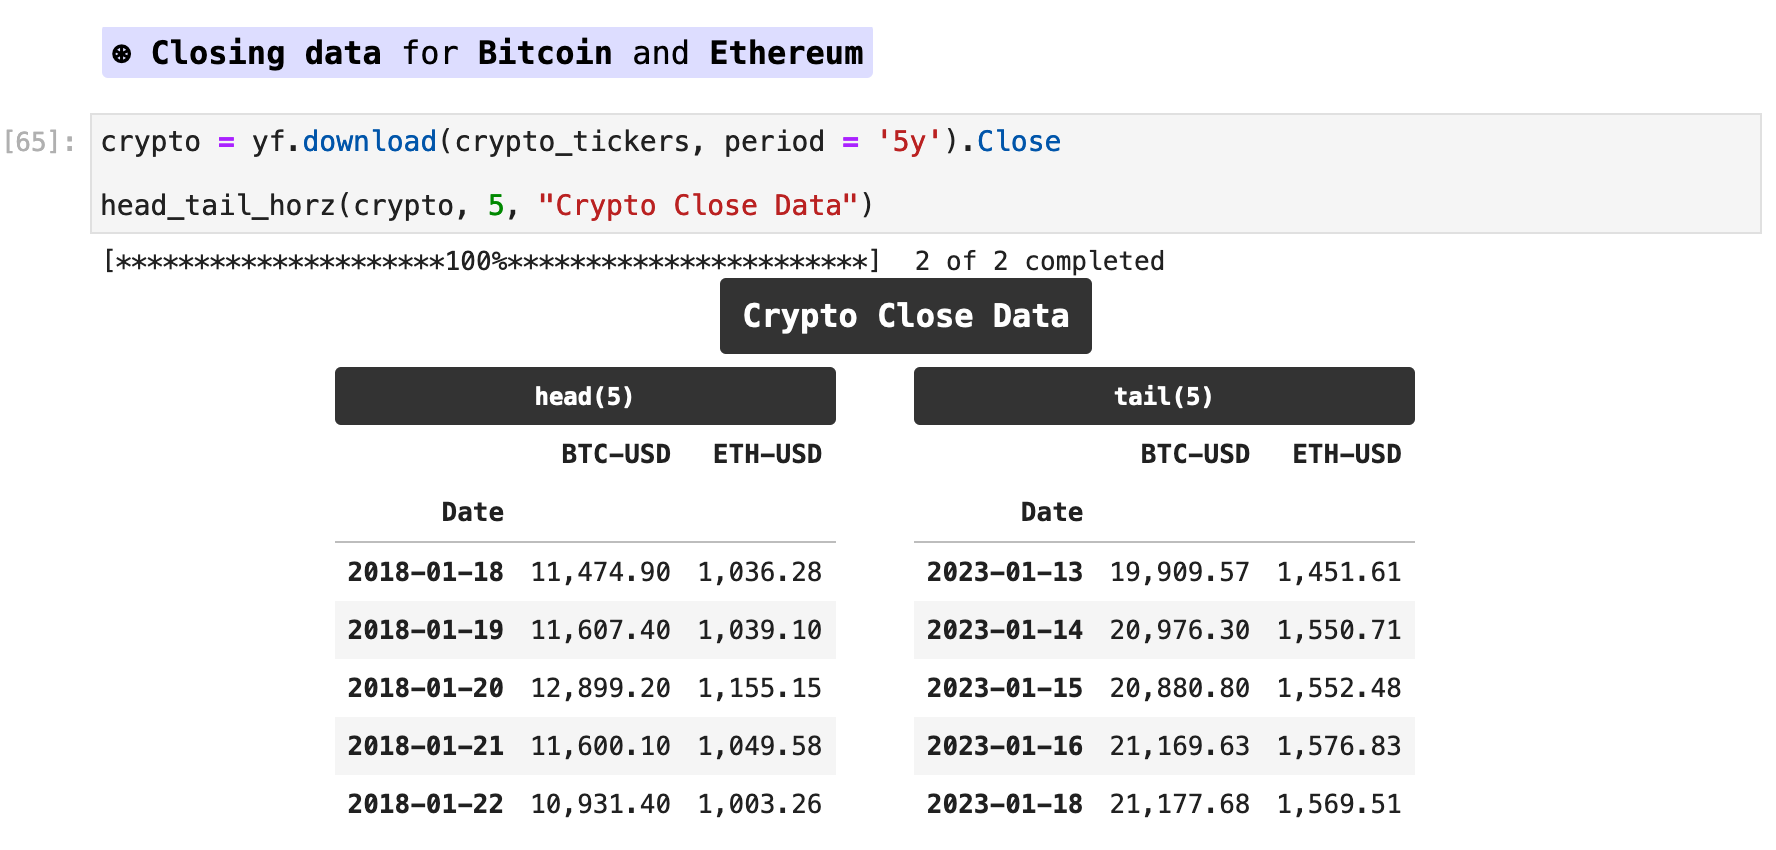
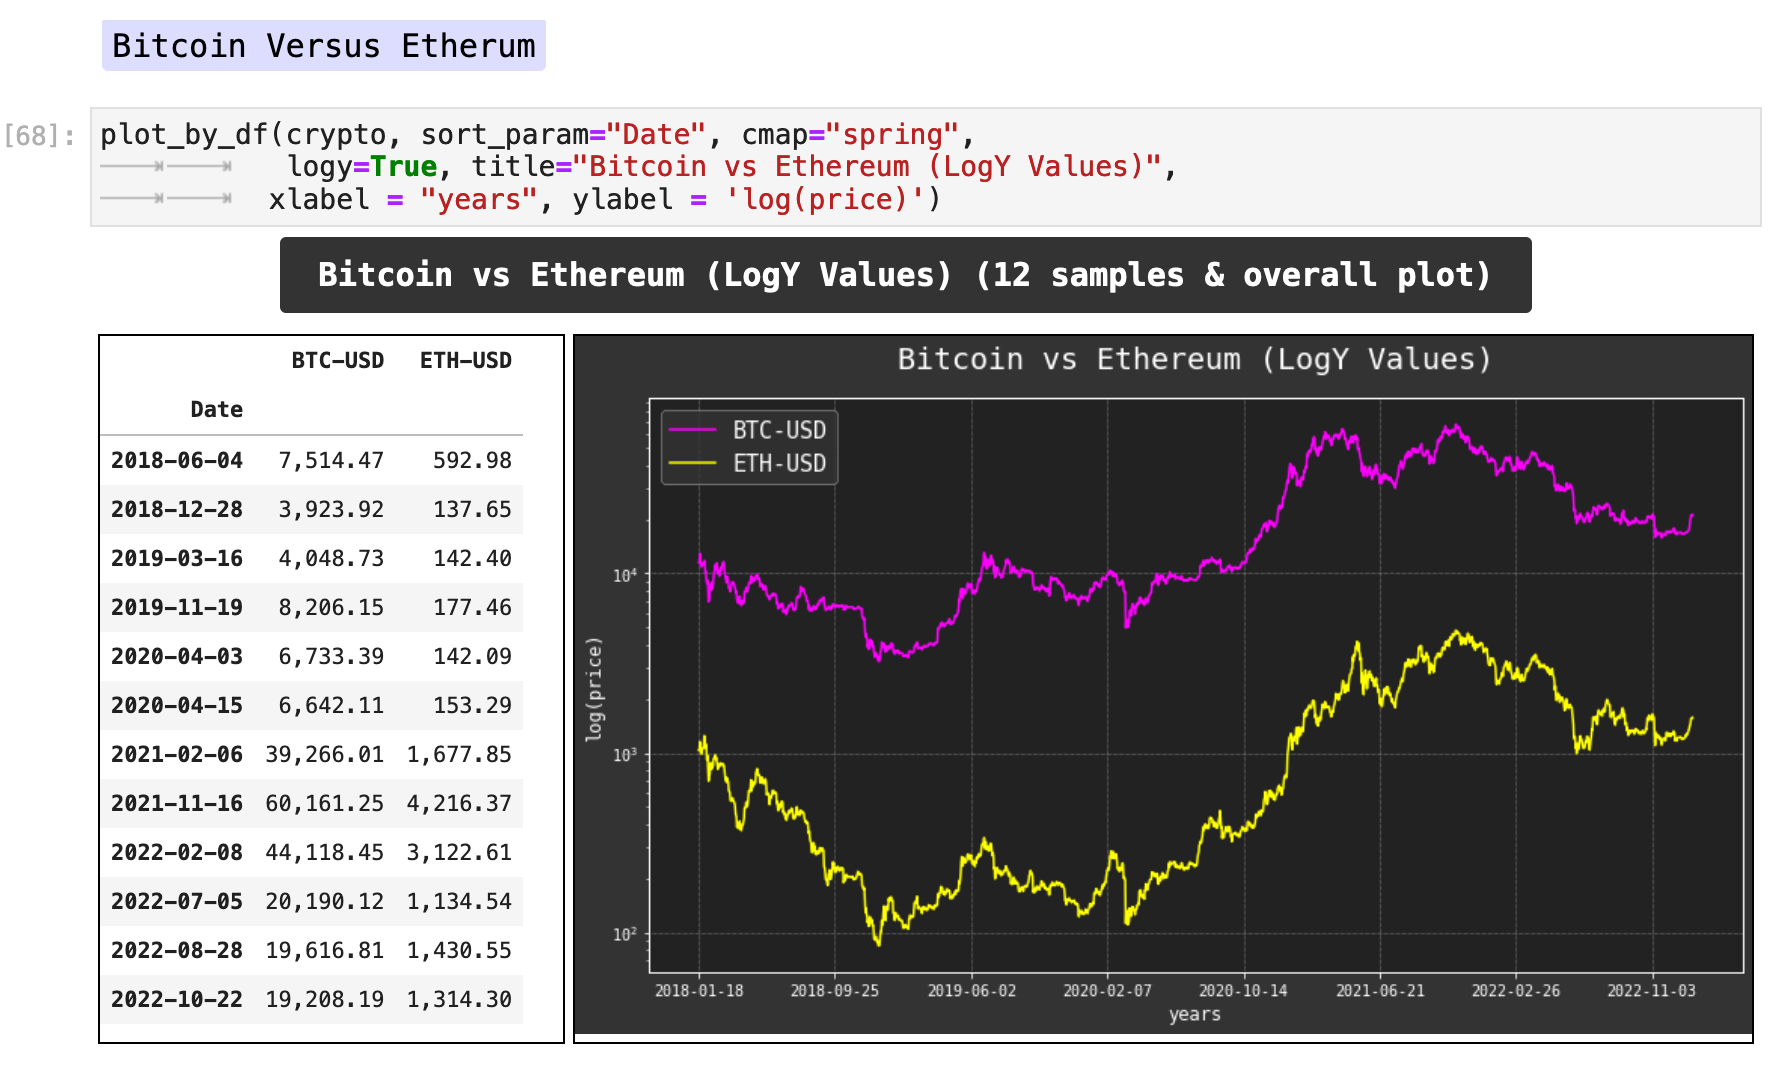
Now that we have saved just the closing data for each cryptocurrency, we can plot their recent performance and compare. I have used log(y) values for pricing to make a more meaningful plot.
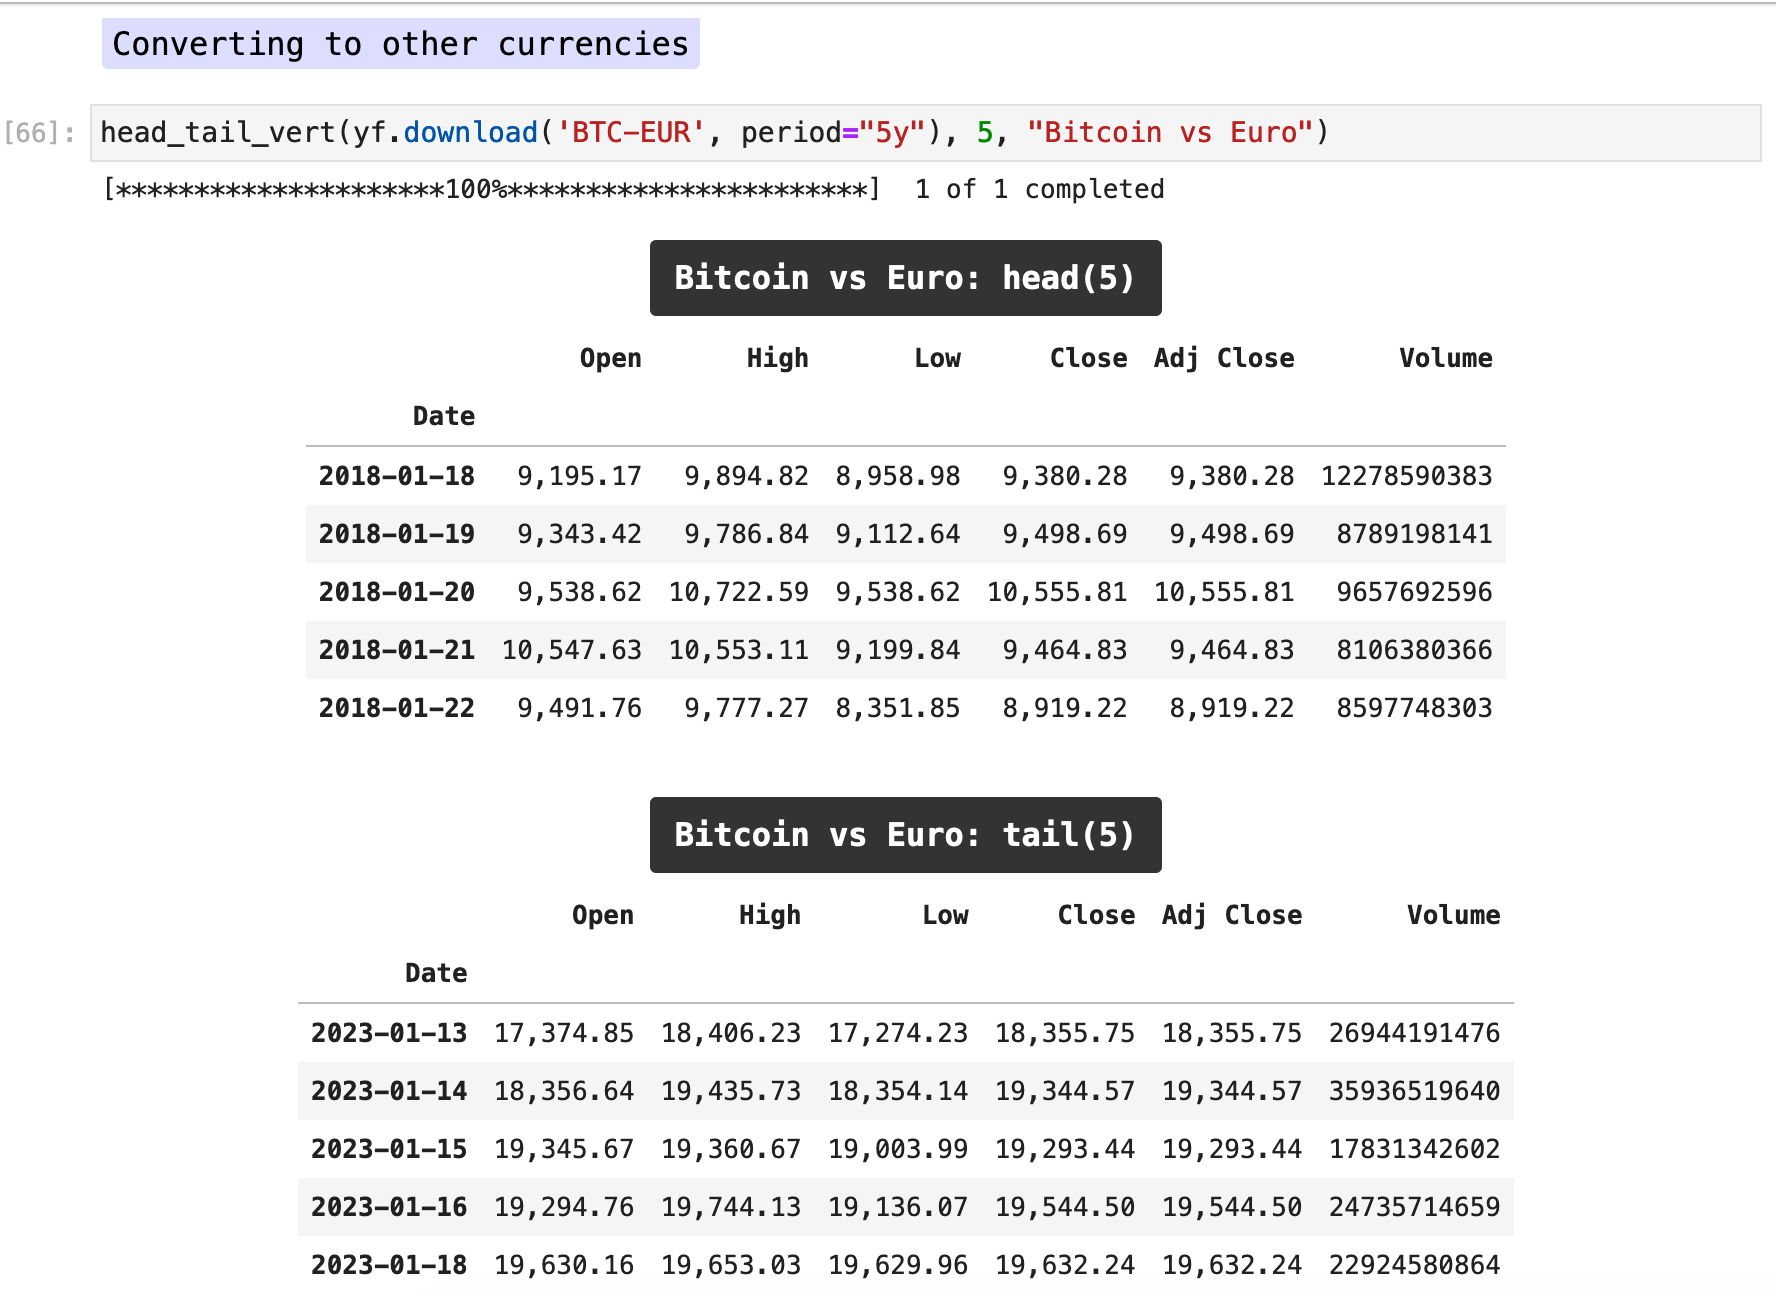
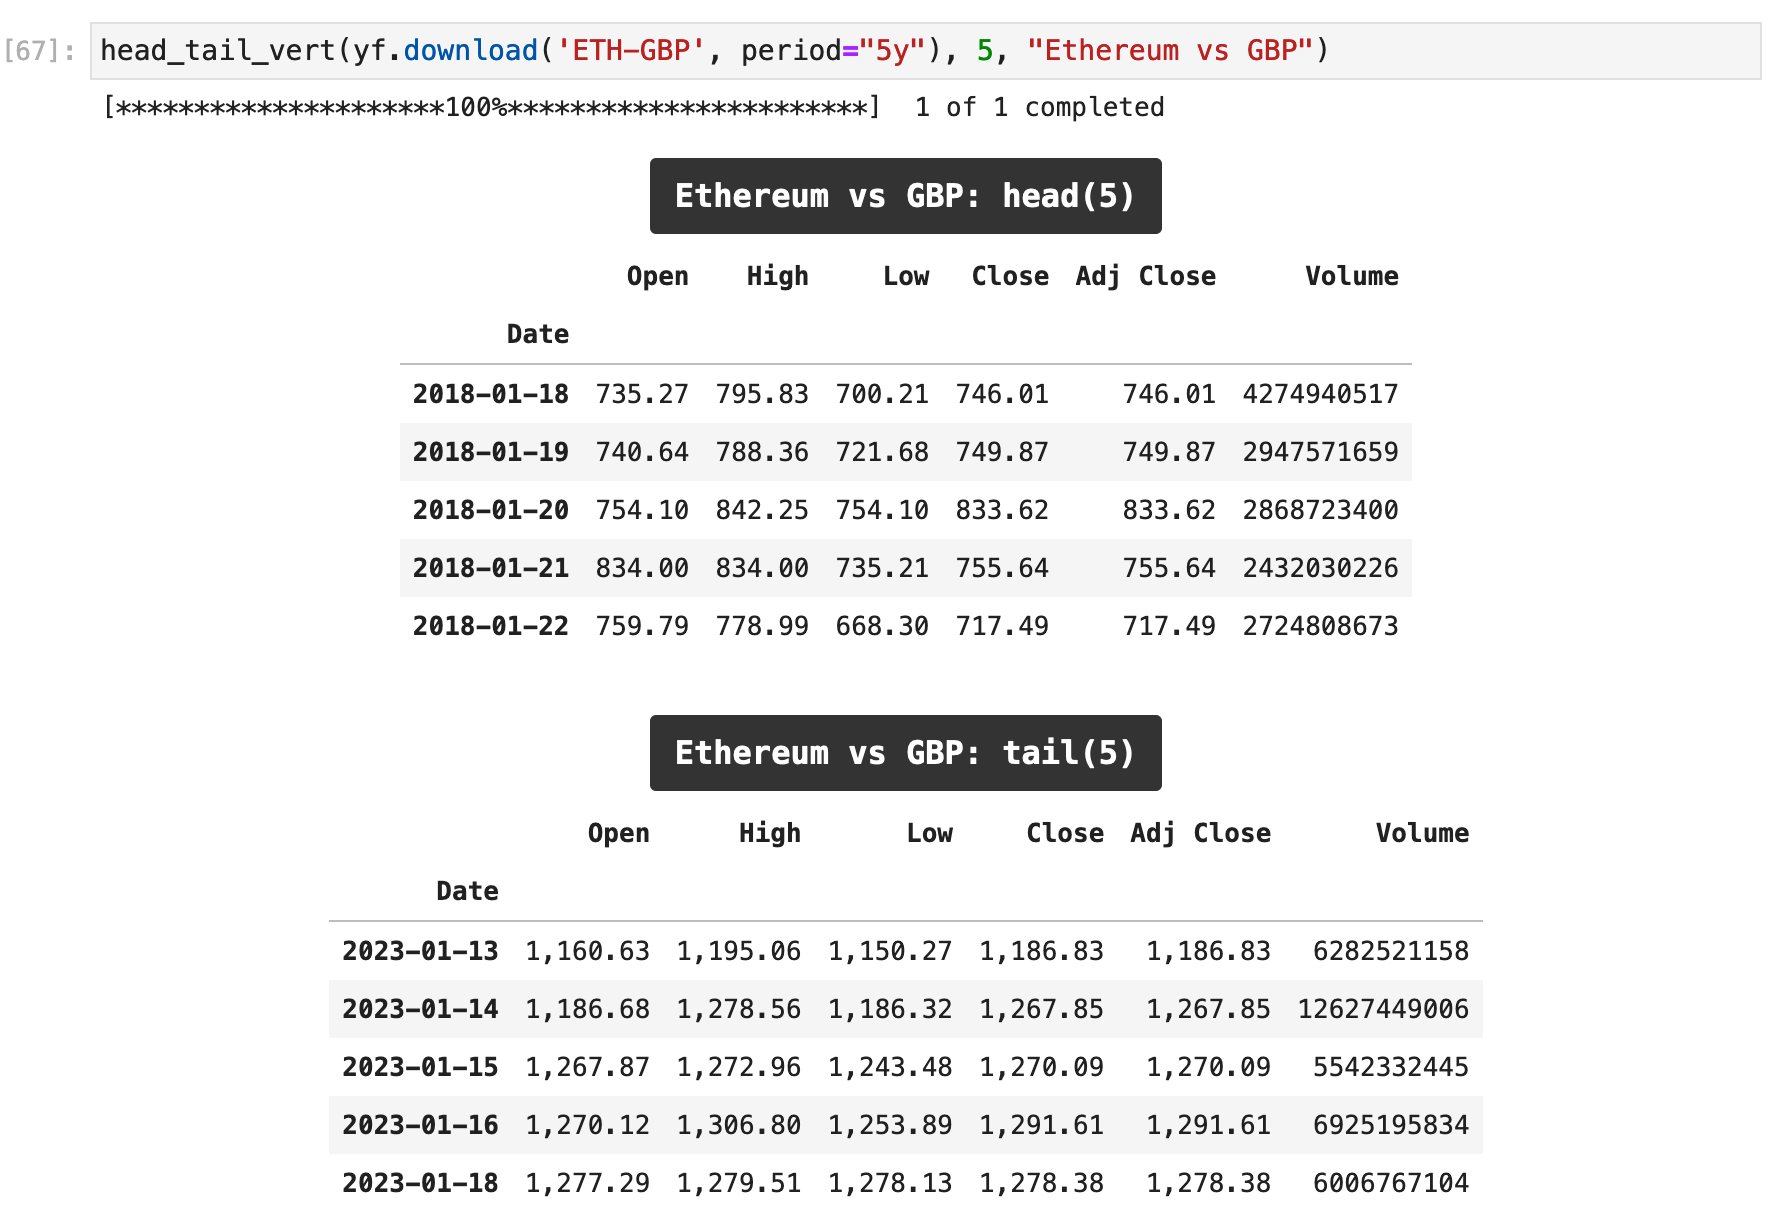
Here are examples of conversions cryptocurrencies to other currencies.

Sections: ● Top ● Historical Data ● Setting Date Range ● High Frenquency ● Splits & Dividends ● Exporting ● Multiple Stocks ● Importing Indexes ● Currency Exchange ● Cryptocurrencies ● Mutual & Exchange Traded Funds ● Treasury Yields ● Ticker Object & Docs ● Stock Fundamentals ● Importing Financials ● Importing Put & Call Options ● Streaming Real-Time ●

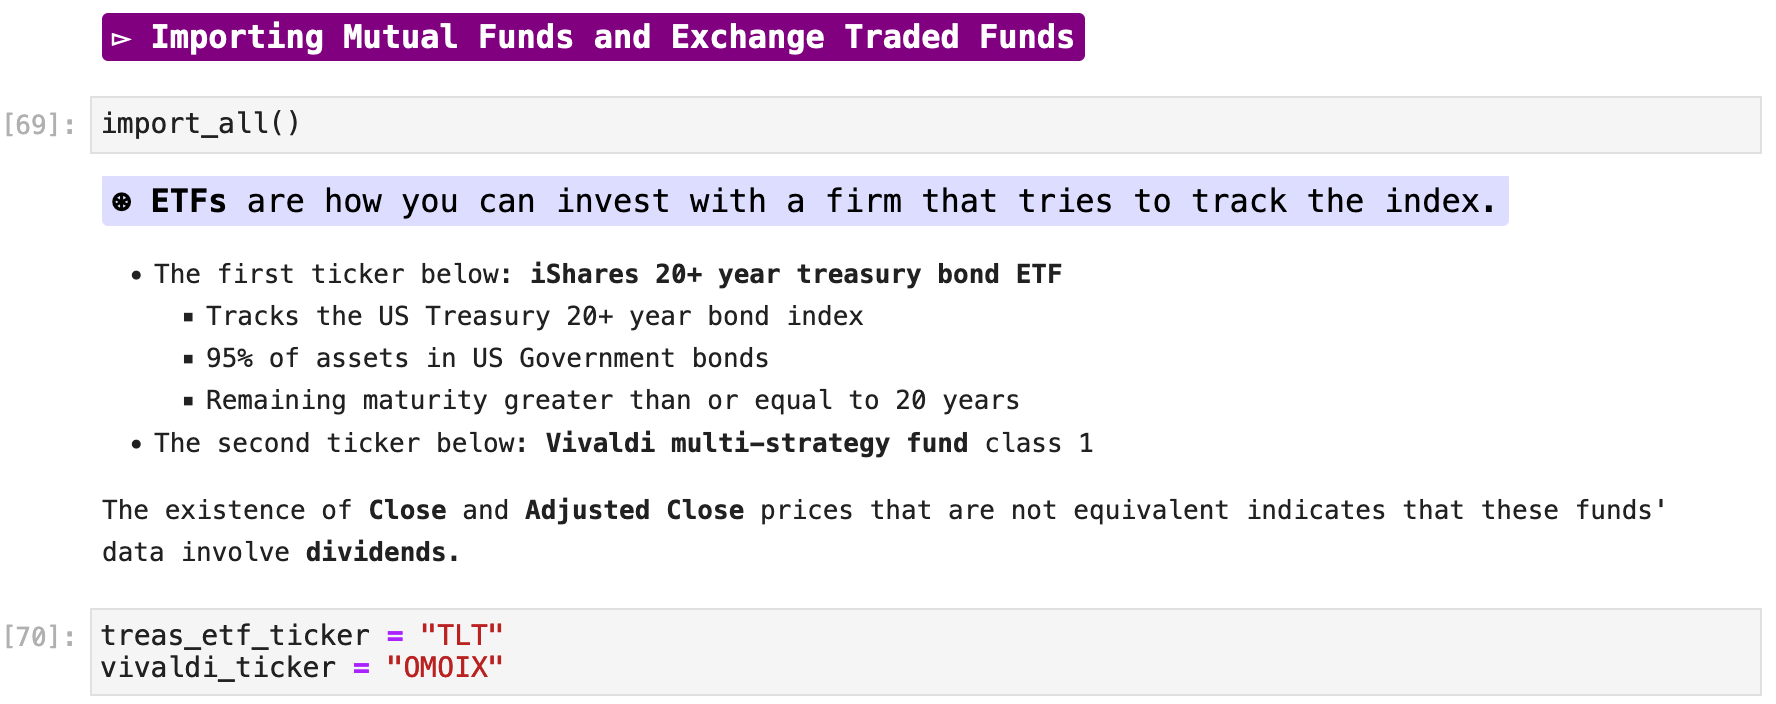
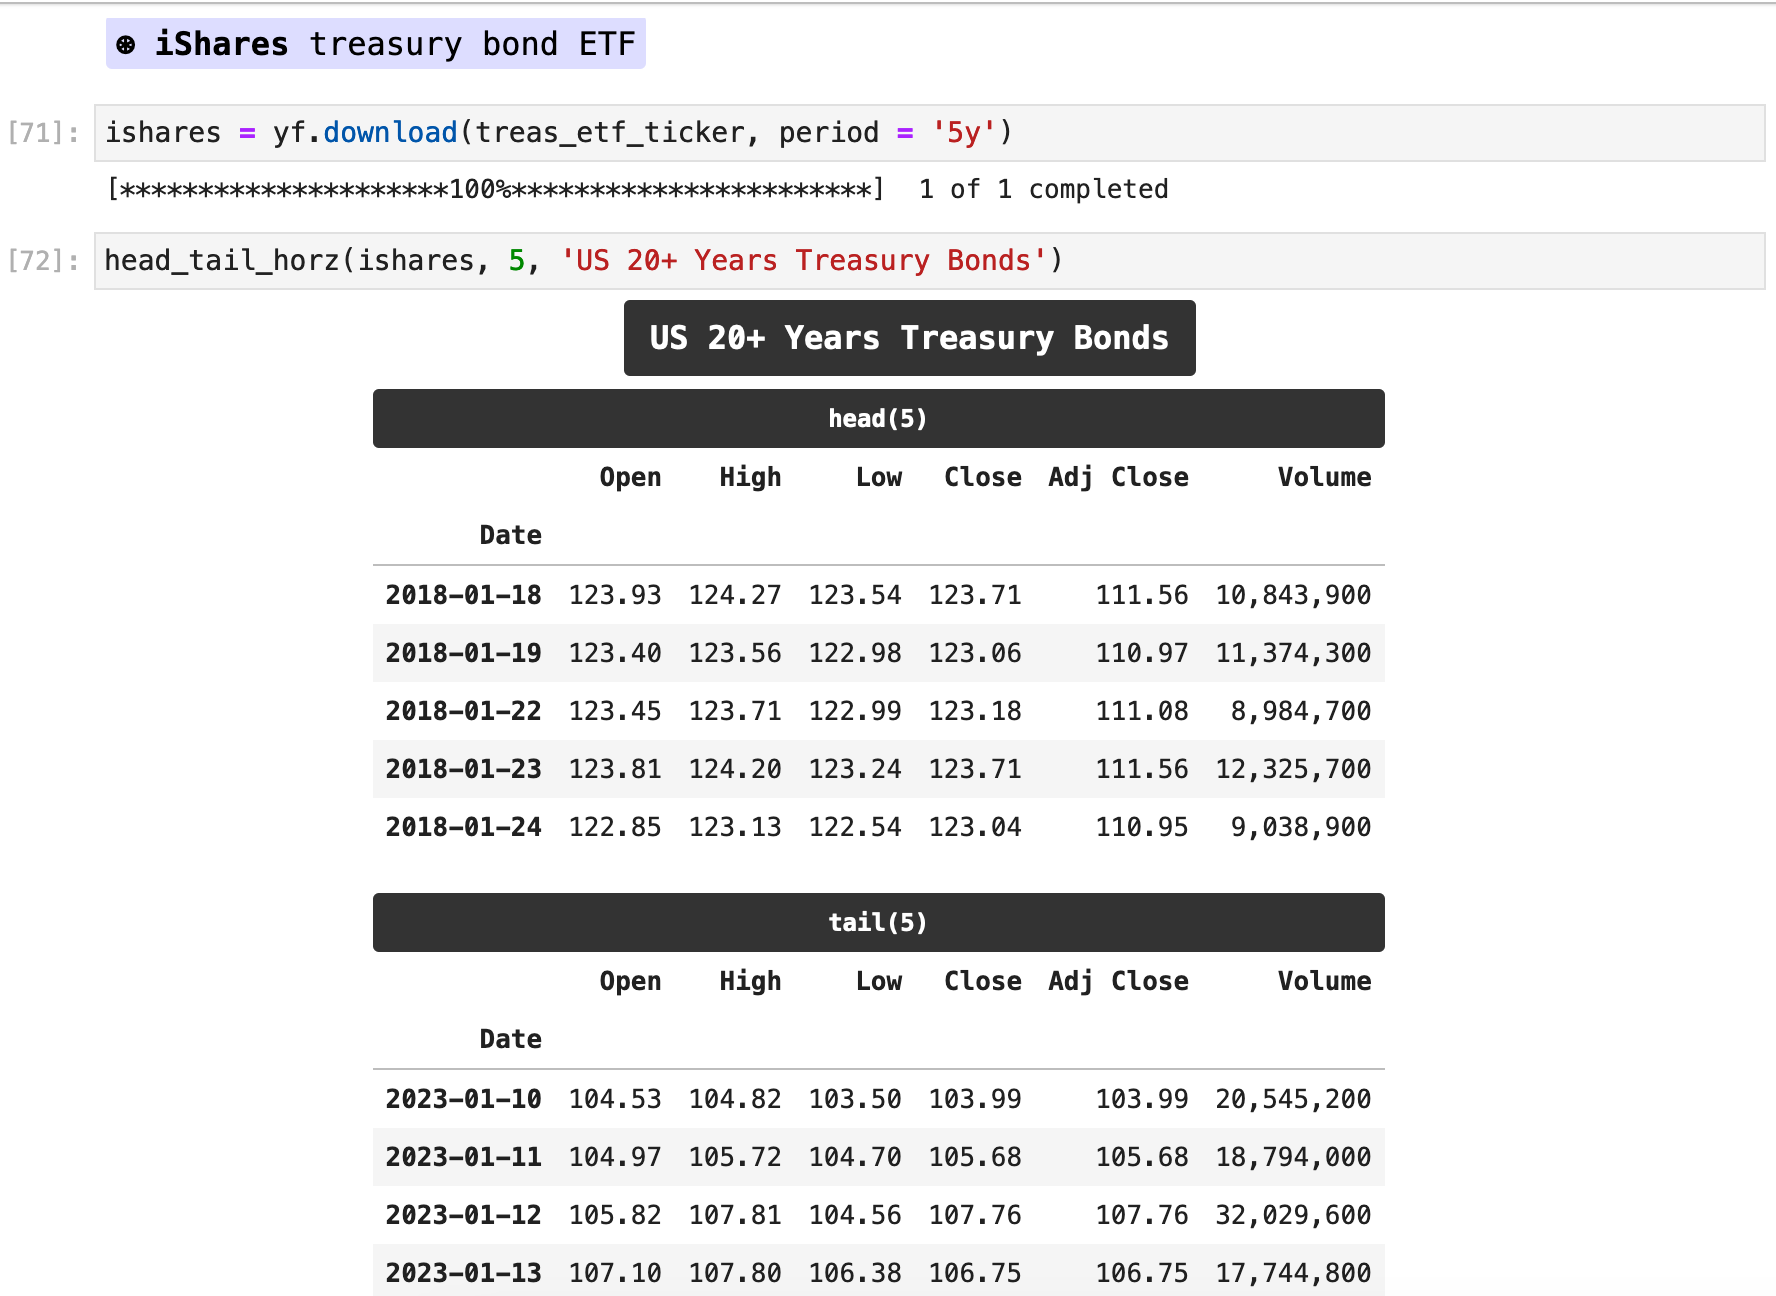
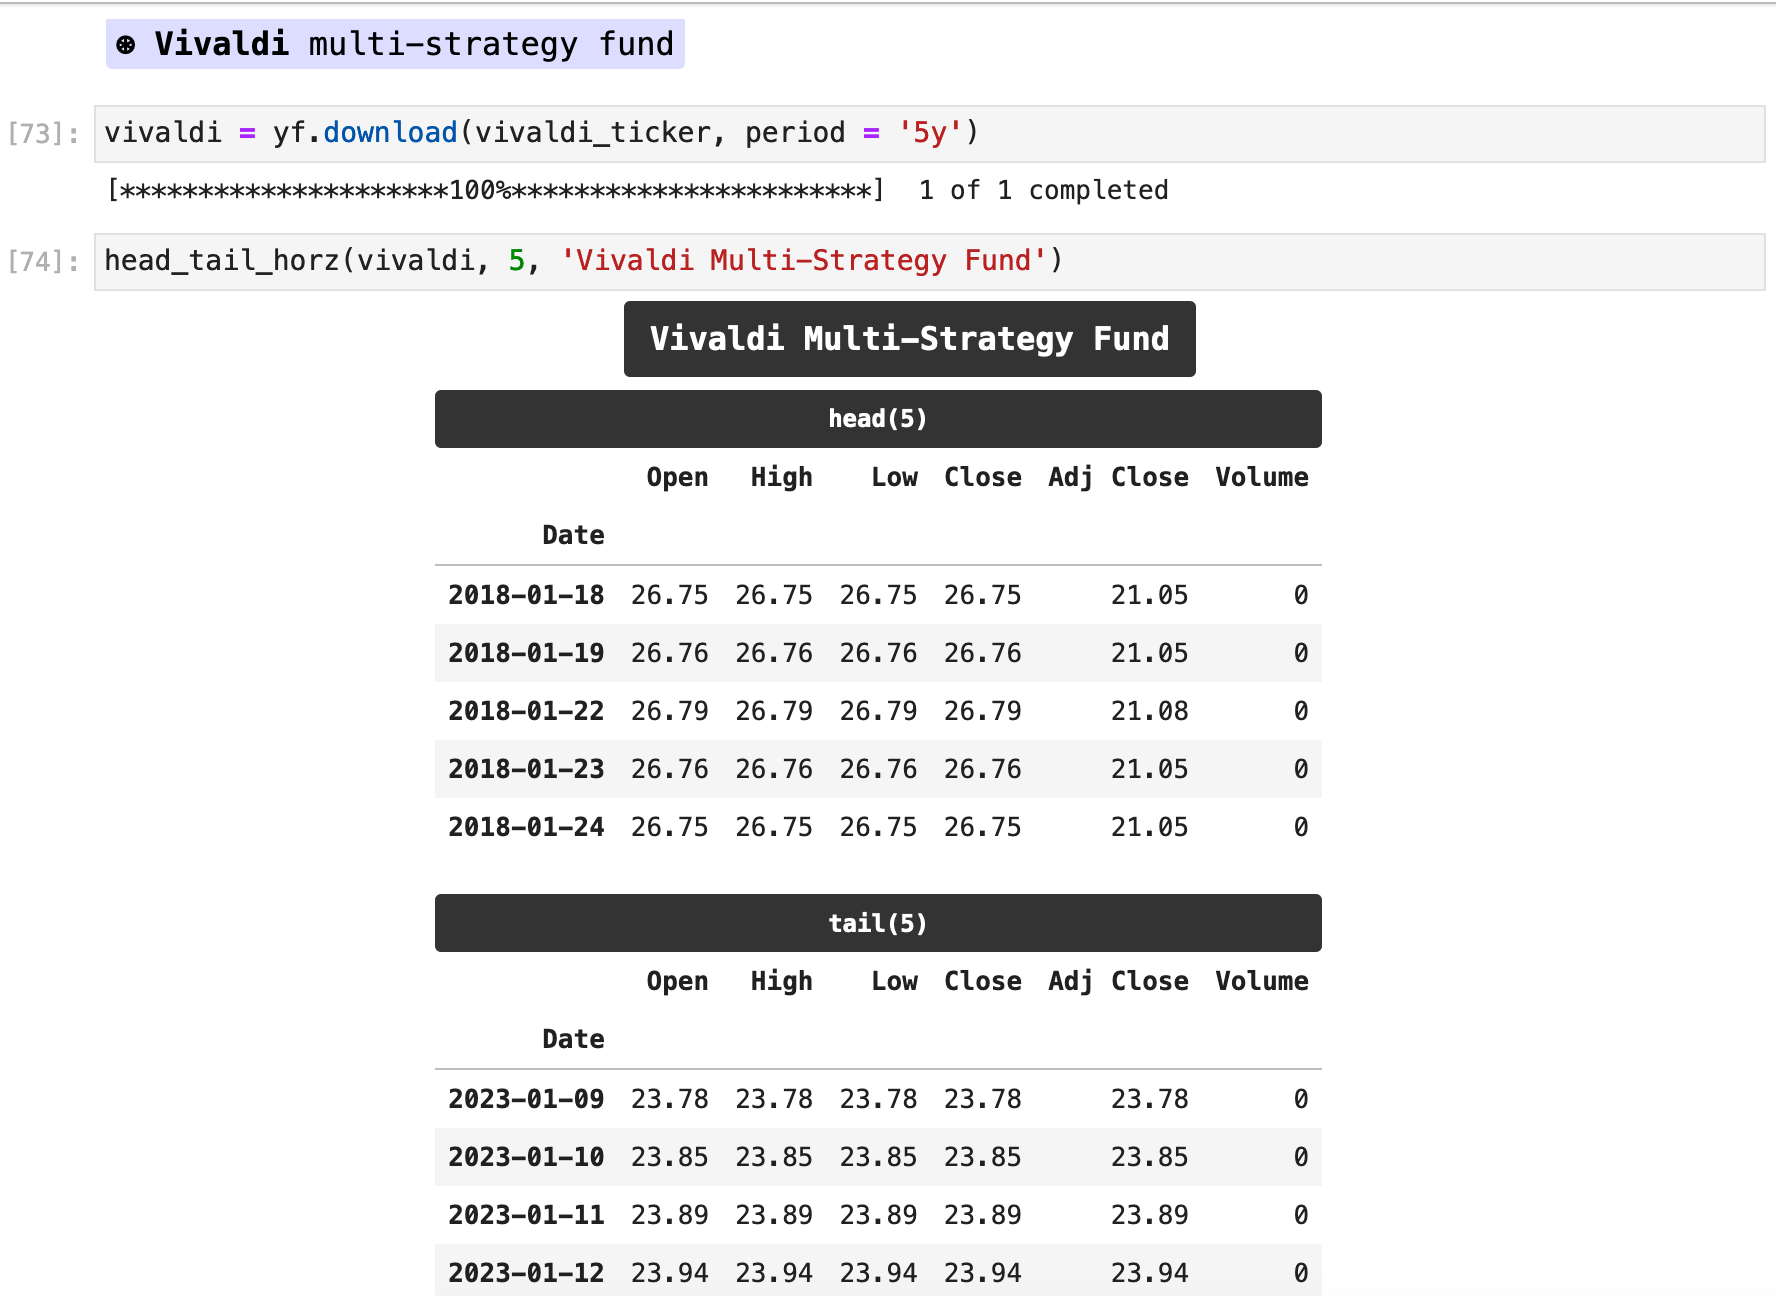
Data on mutual funds and exchange-traded funds are also available on Yahoo Finance. Below, I am using iShares 20+ year treasury bond ETF and the Vivaldi mutli-strategy fund as examples.

Sections: ● Top ● Historical Data ● Setting Date Range ● High Frenquency ● Splits & Dividends ● Exporting ● Multiple Stocks ● Importing Indexes ● Currency Exchange ● Cryptocurrencies ● Mutual & Exchange Traded Funds ● Treasury Yields ● Ticker Object & Docs ● Stock Fundamentals ● Importing Financials ● Importing Put & Call Options ● Streaming Real-Time ●

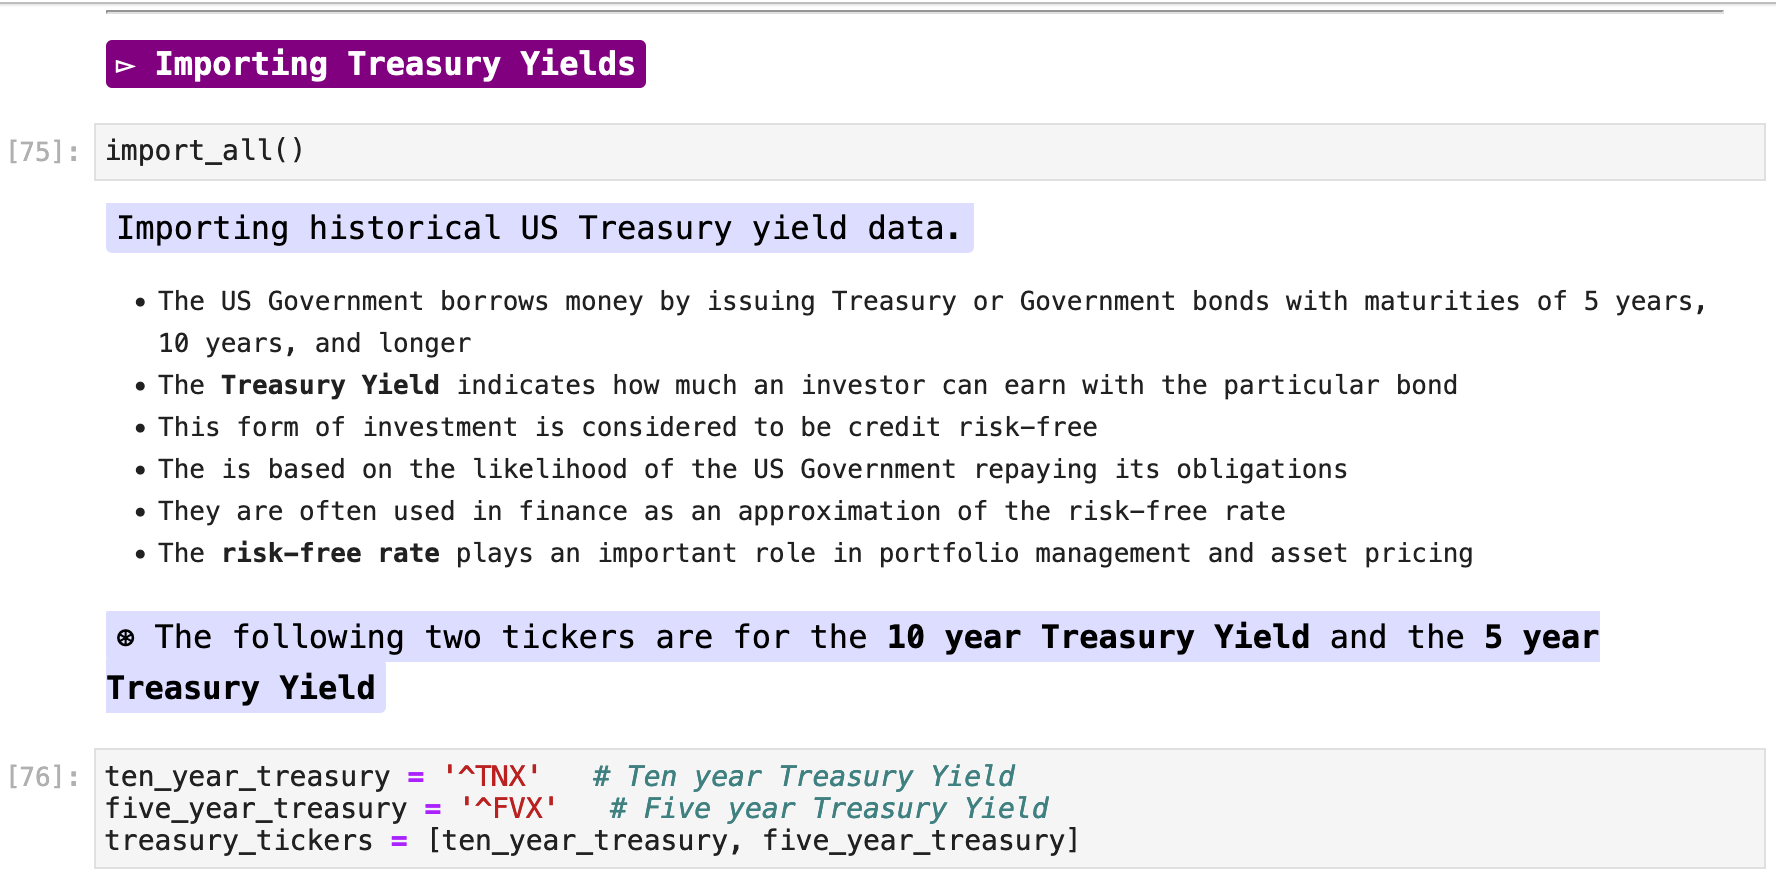
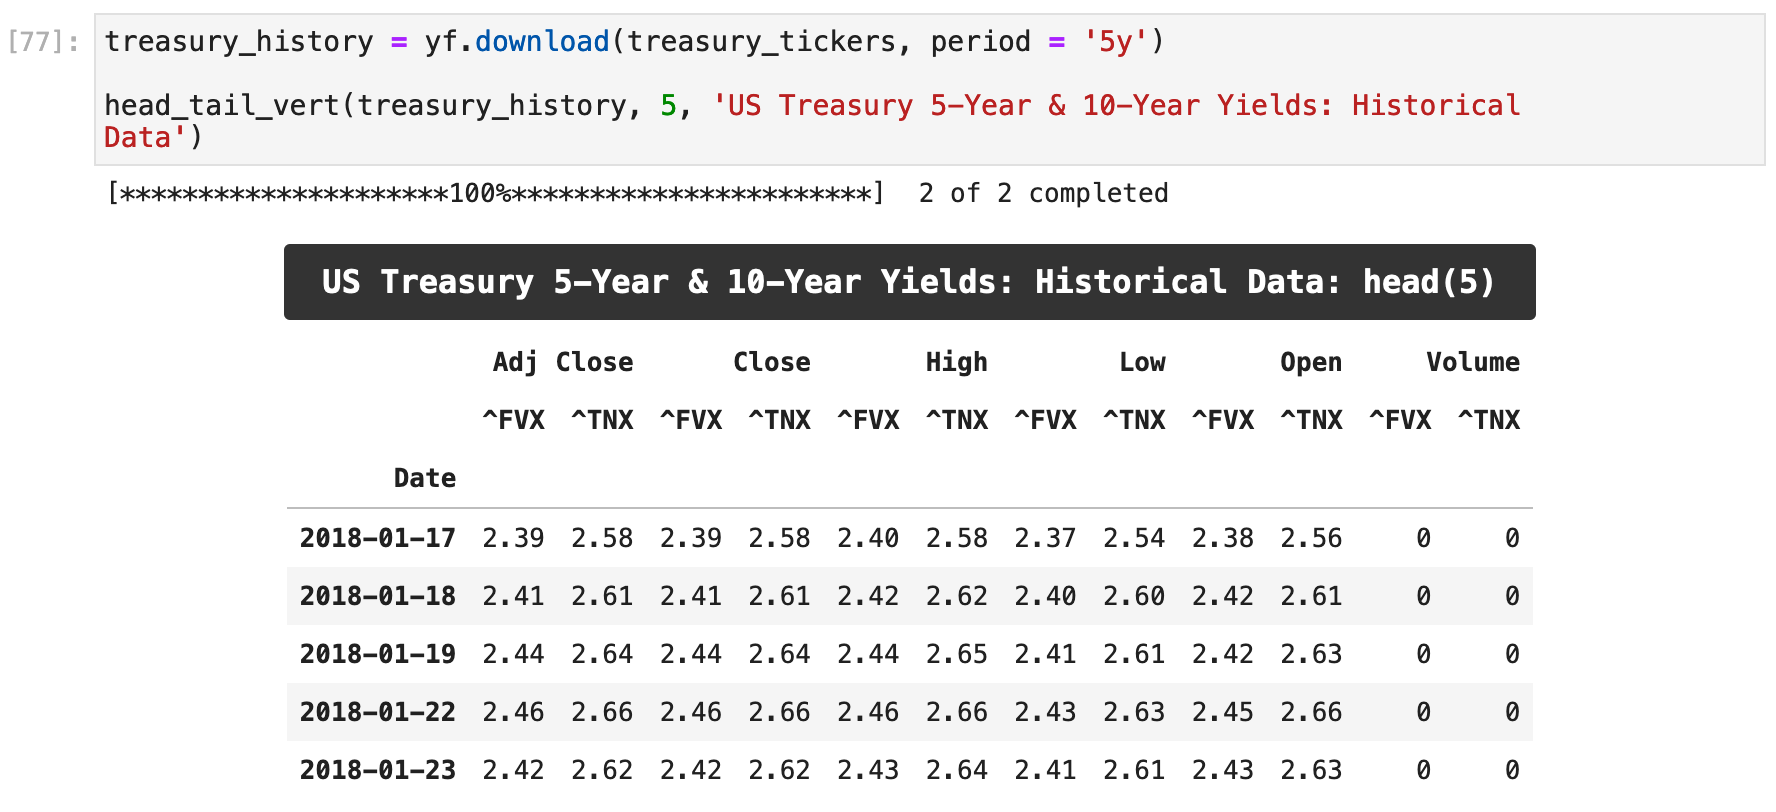
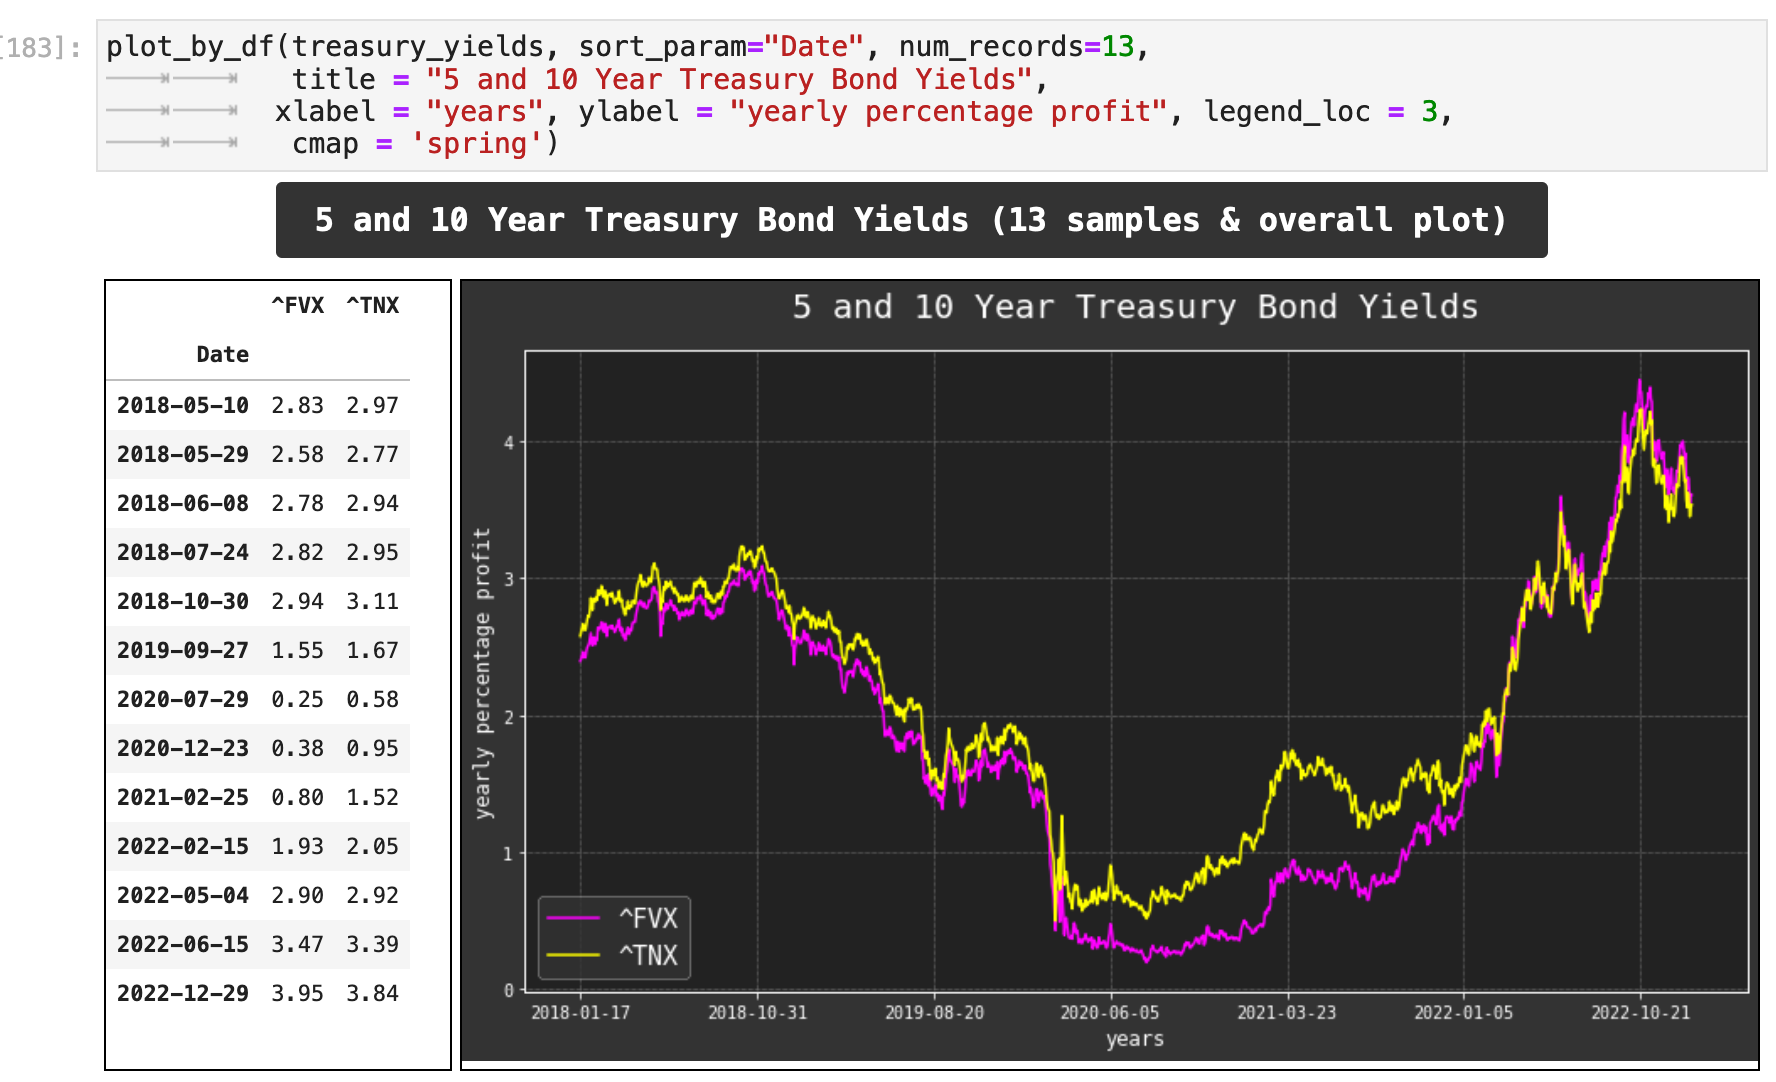
We can also retrieve data on the US Government’s treasury bonds from Yahoo Finance. Below I have chosen the 5 year and 10 year treasury bonds. In the notebook excerpts below, there is more explanation of treasury bonds and how they function as investments.
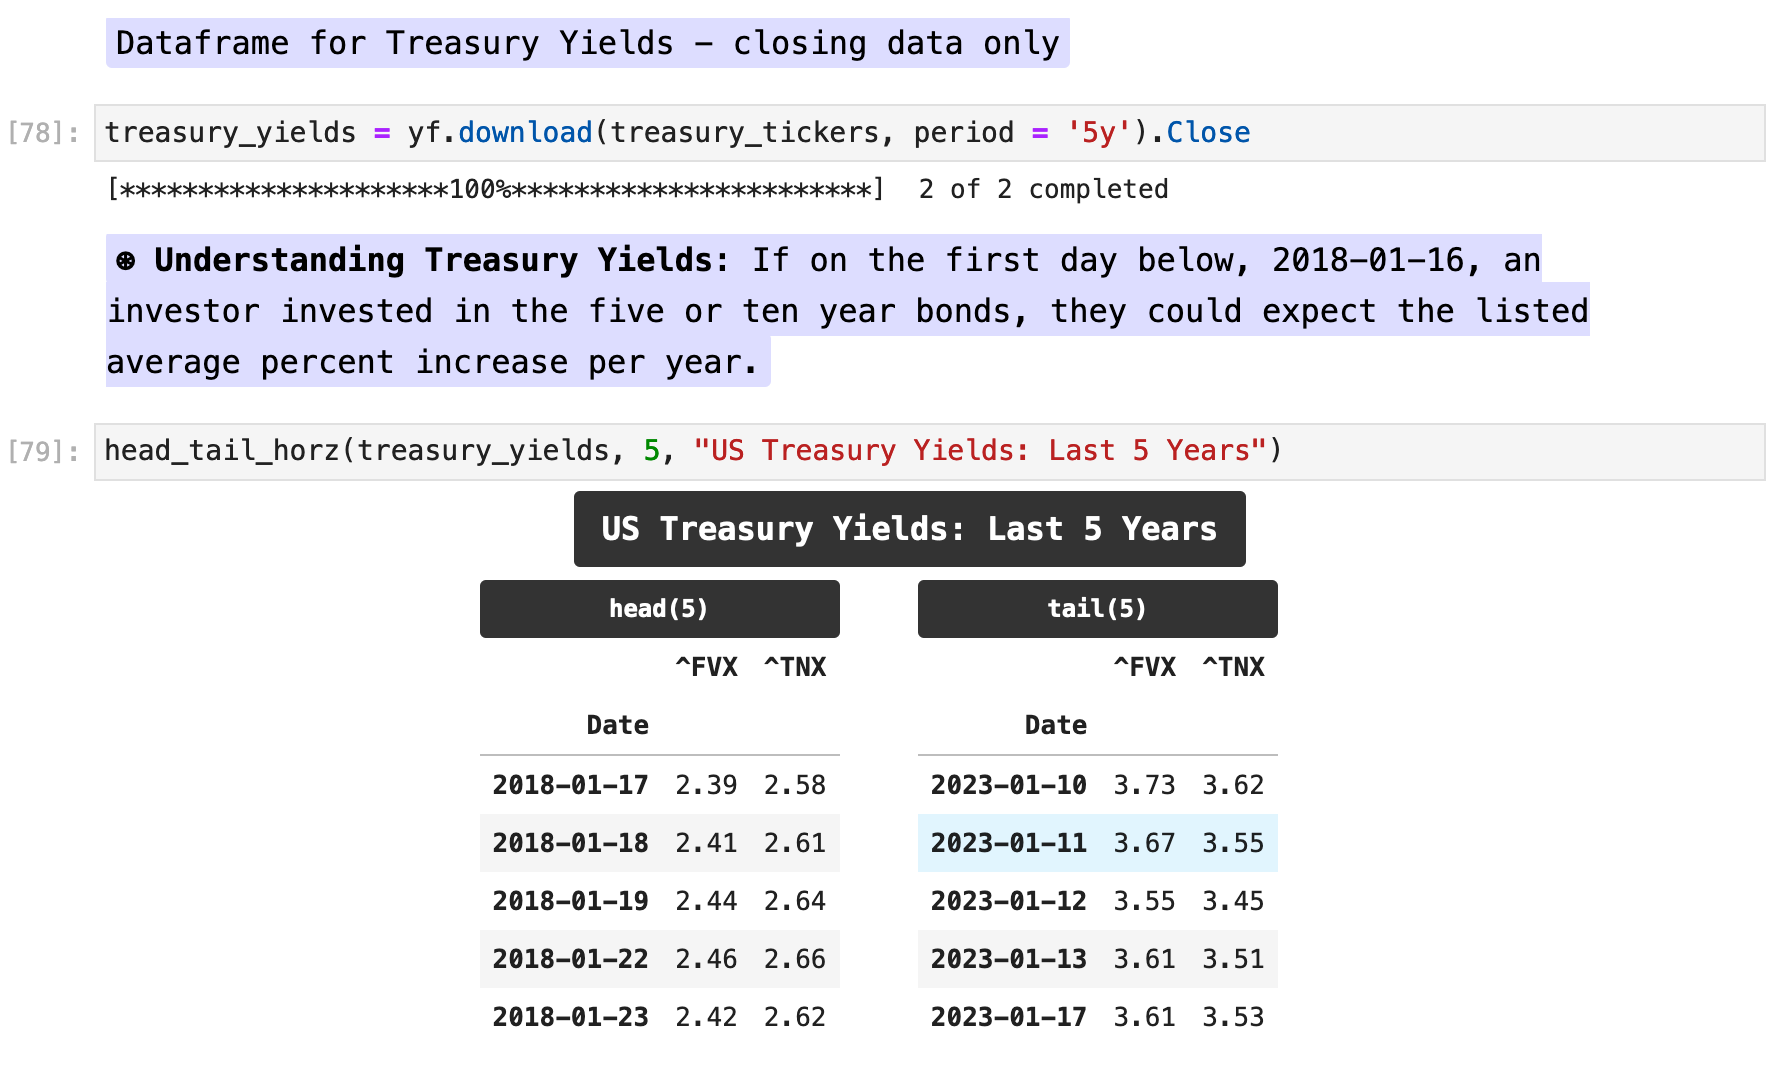
With only the Close column retained, we can now plot the performance of the 5 year treasury bonds compared with the 10 year.

Sections: ● Top ● Historical Data ● Setting Date Range ● High Frenquency ● Splits & Dividends ● Exporting ● Multiple Stocks ● Importing Indexes ● Currency Exchange ● Cryptocurrencies ● Mutual & Exchange Traded Funds ● Treasury Yields ● Ticker Object & Docs ● Stock Fundamentals ● Importing Financials ● Importing Put & Call Options ● Streaming Real-Time ●

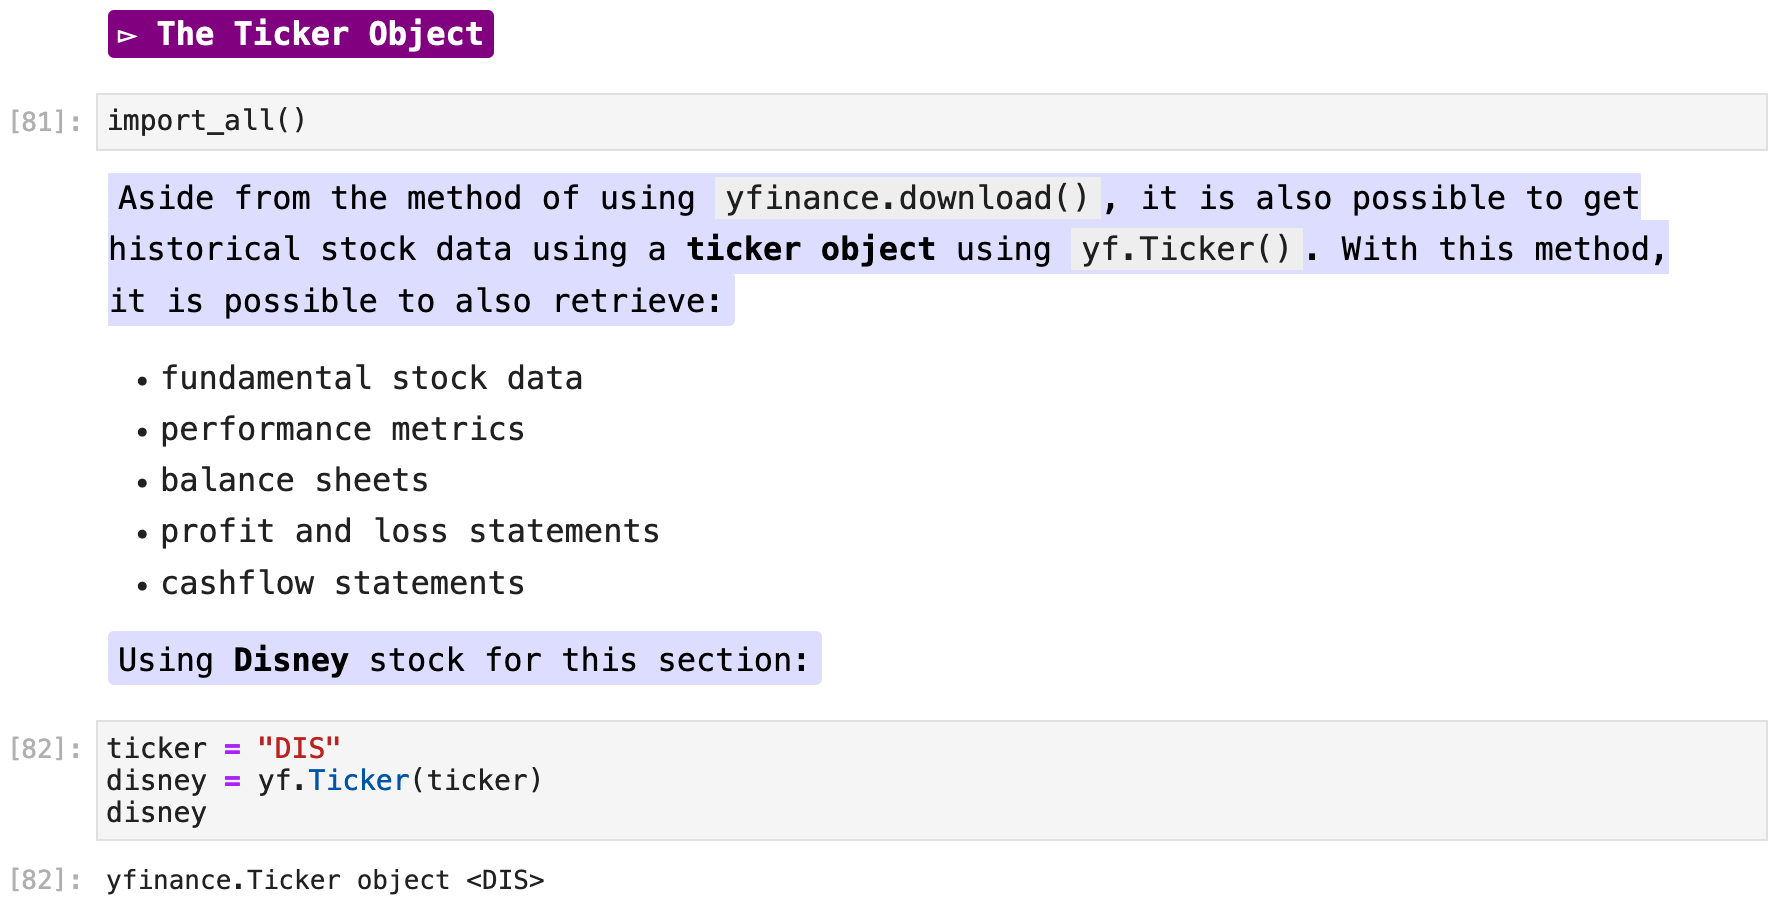
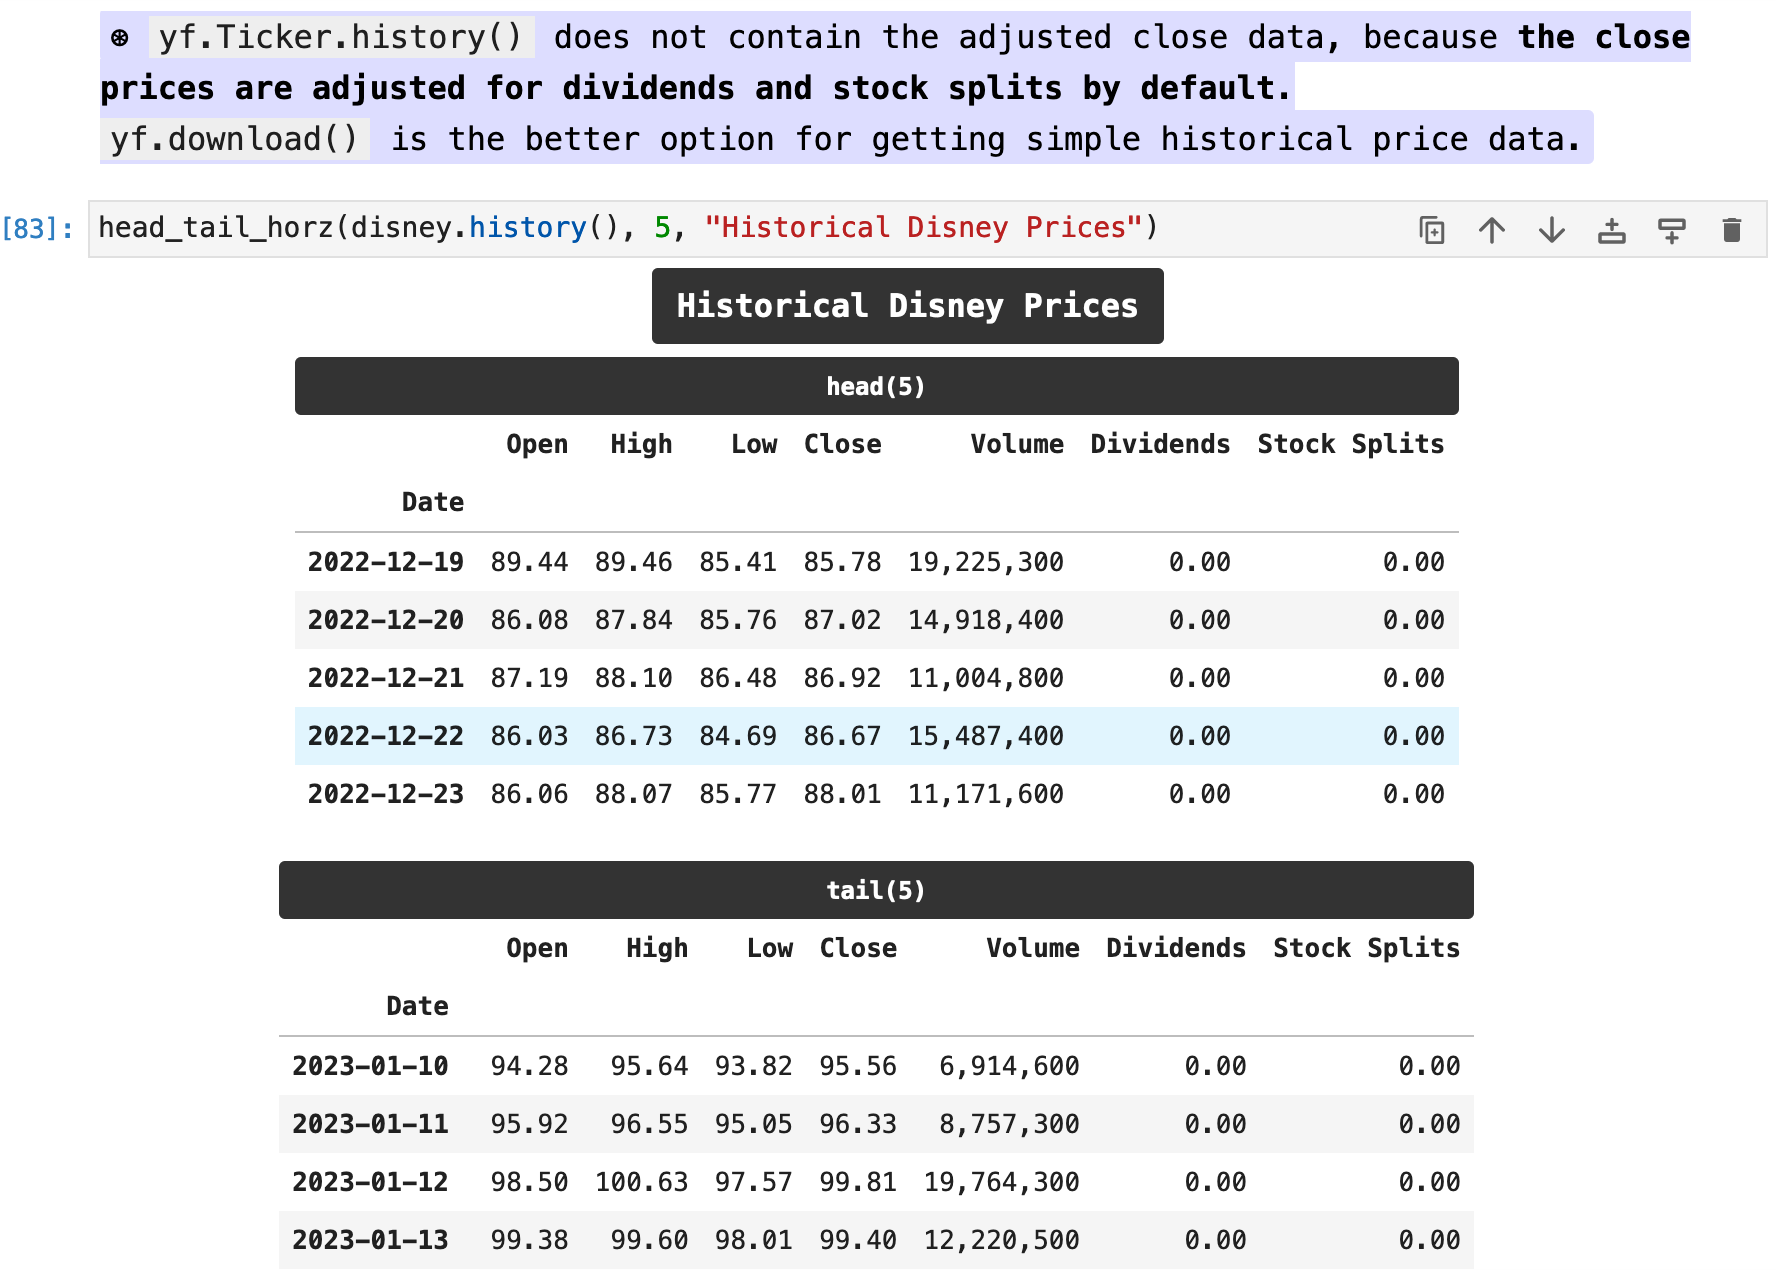
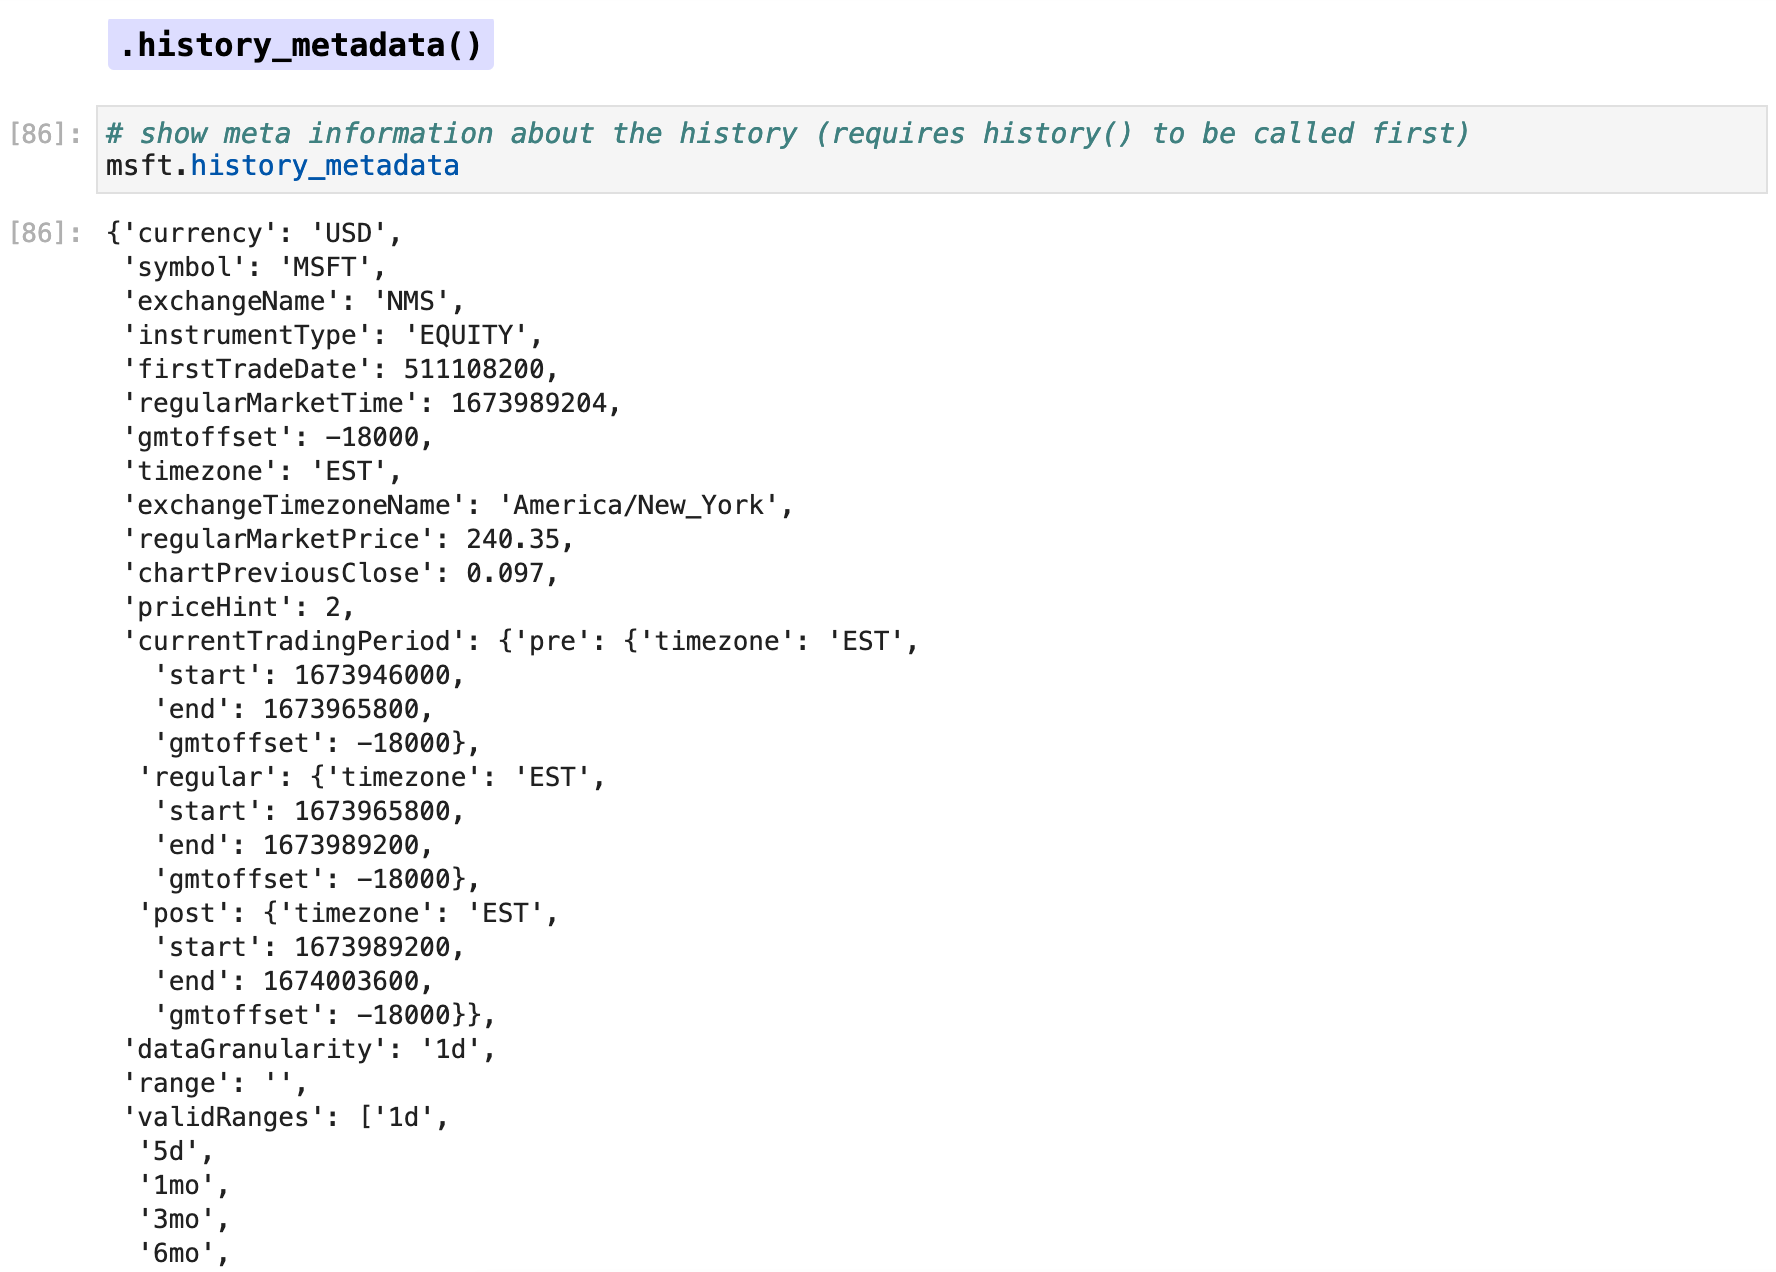
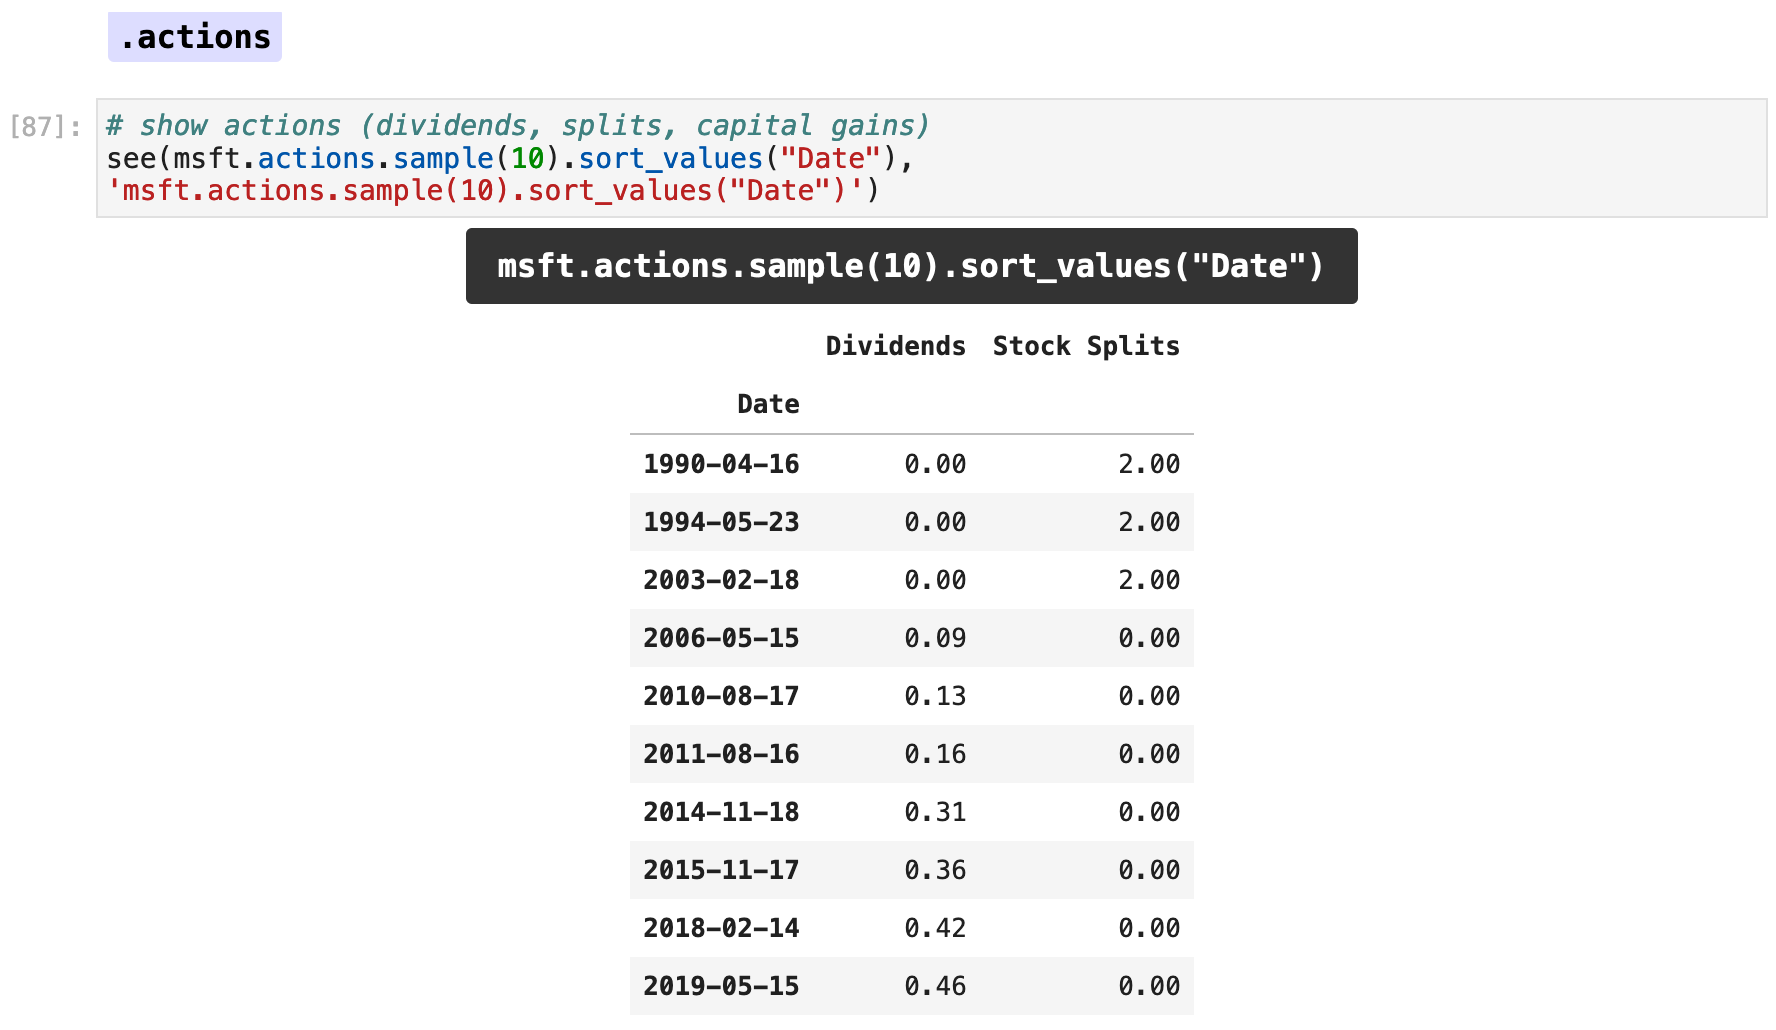
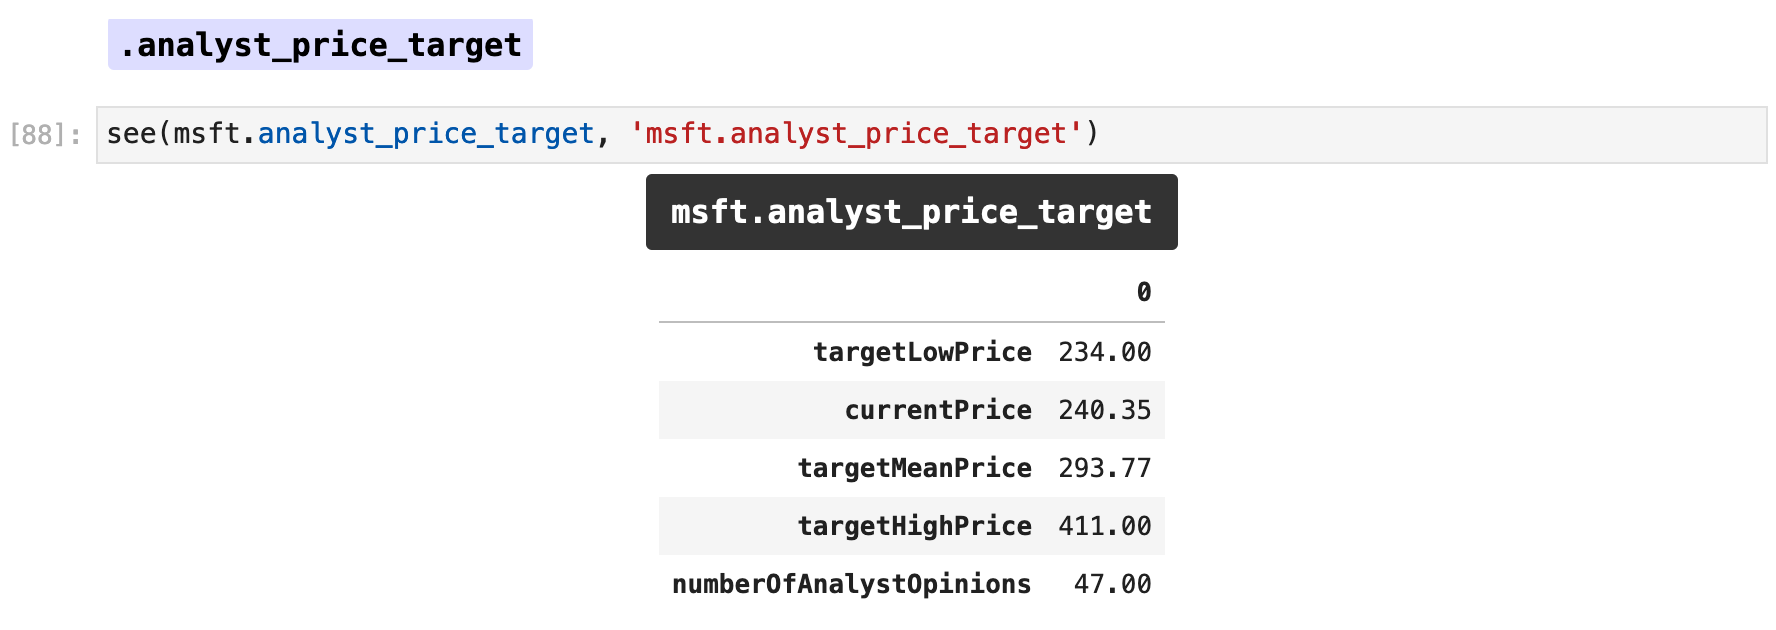
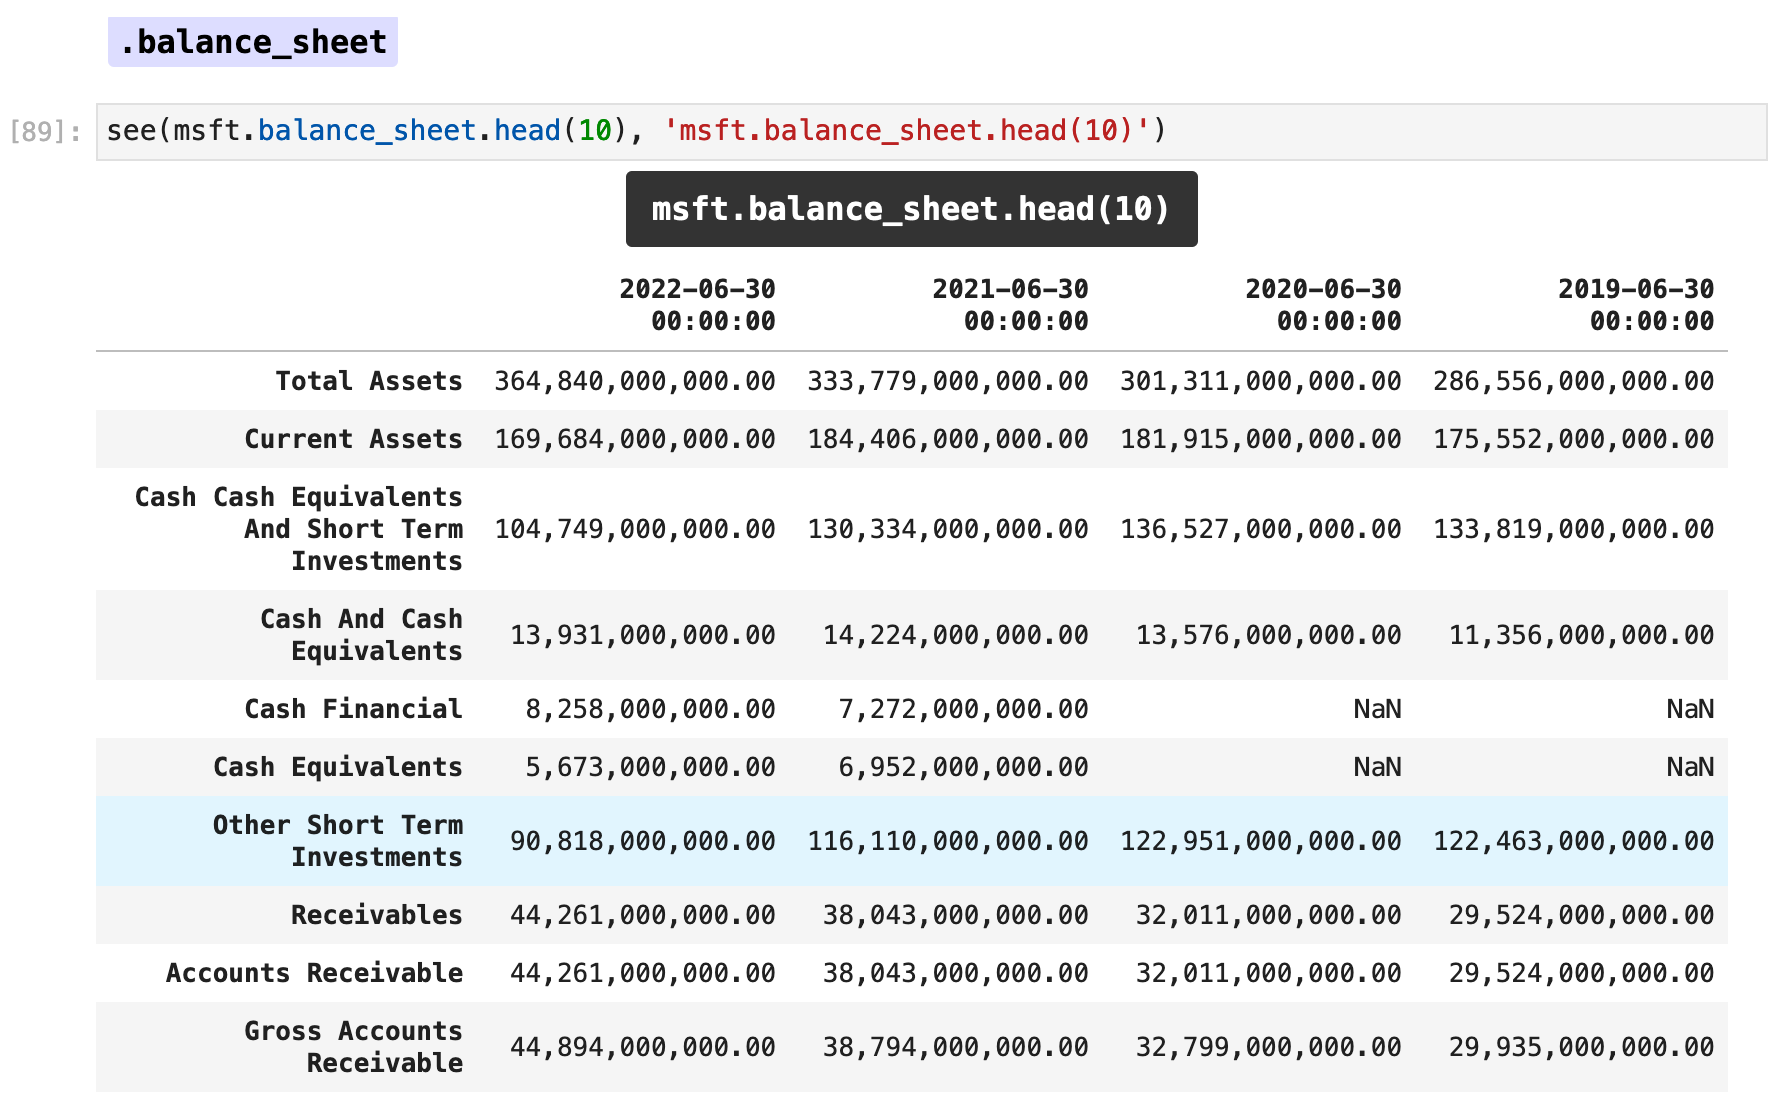
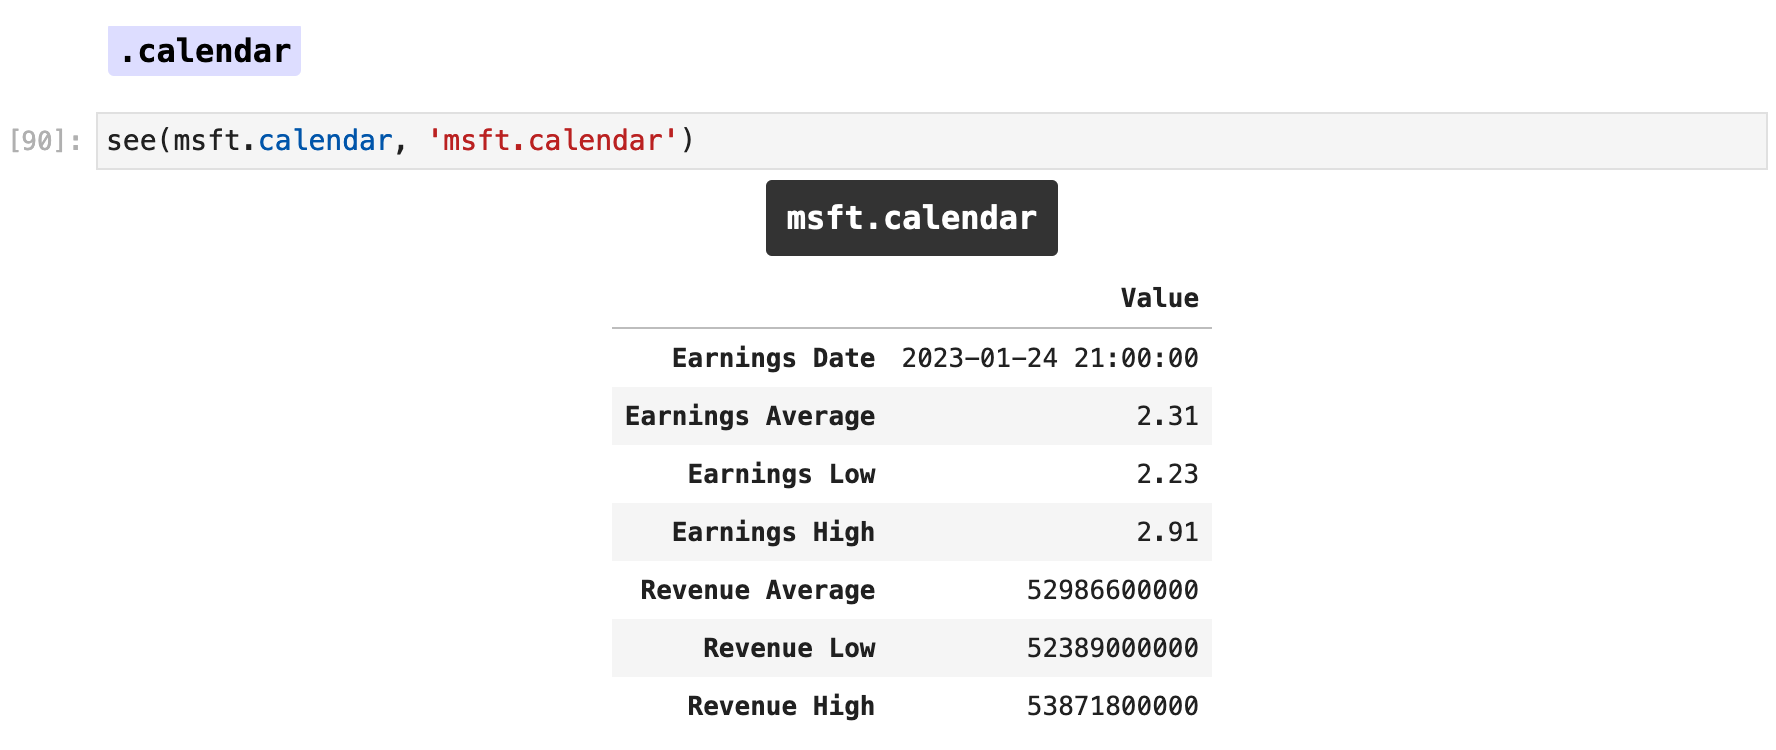
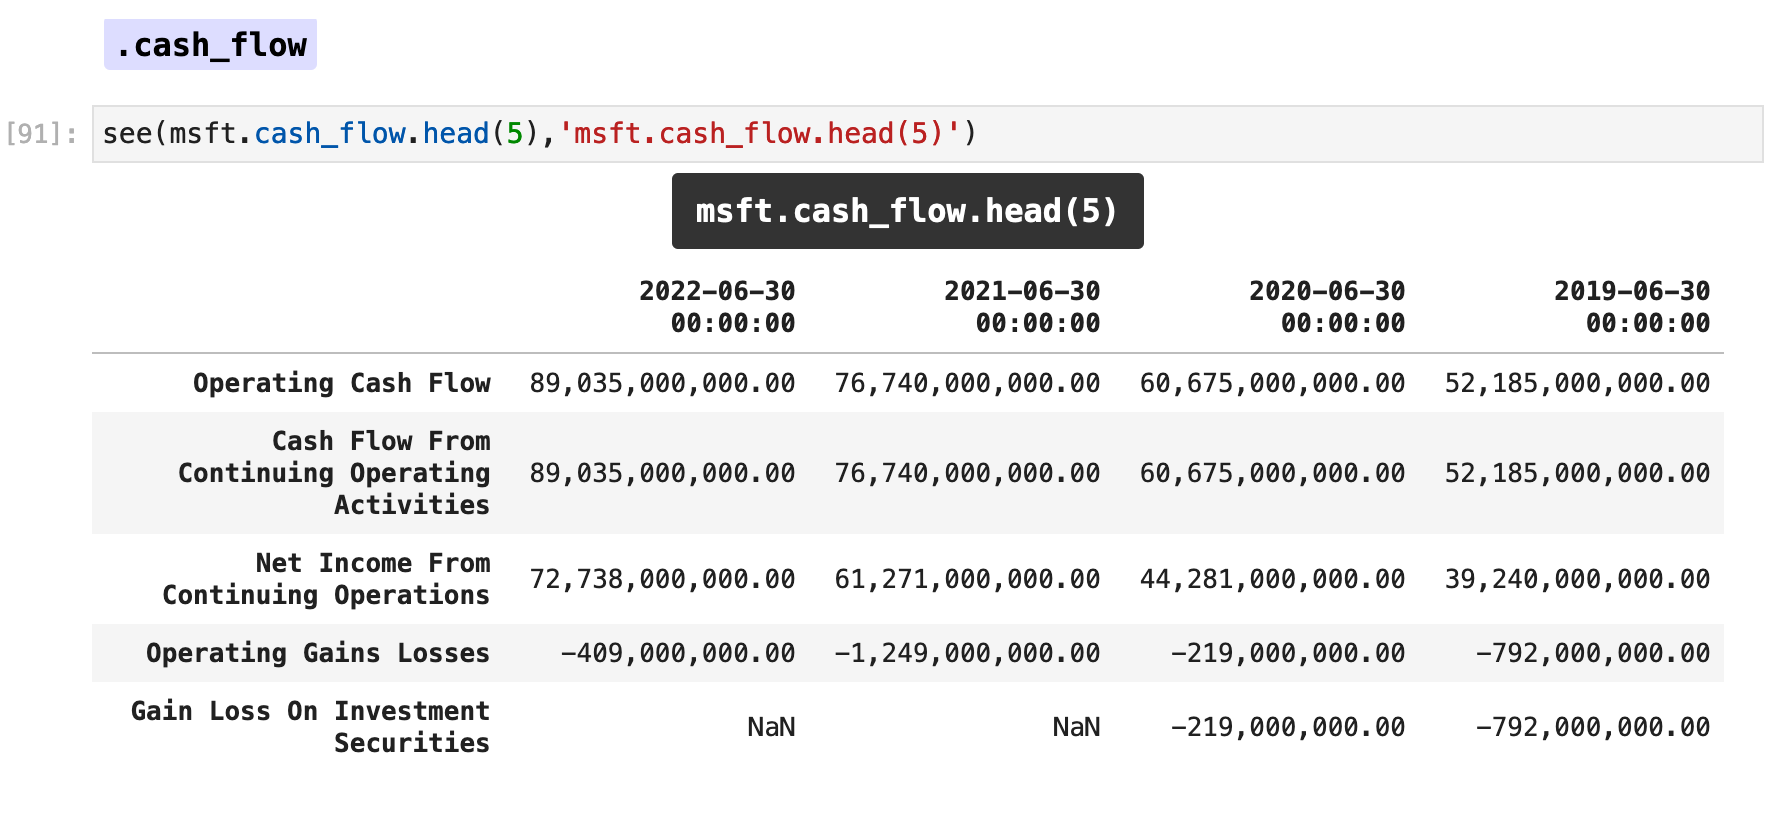
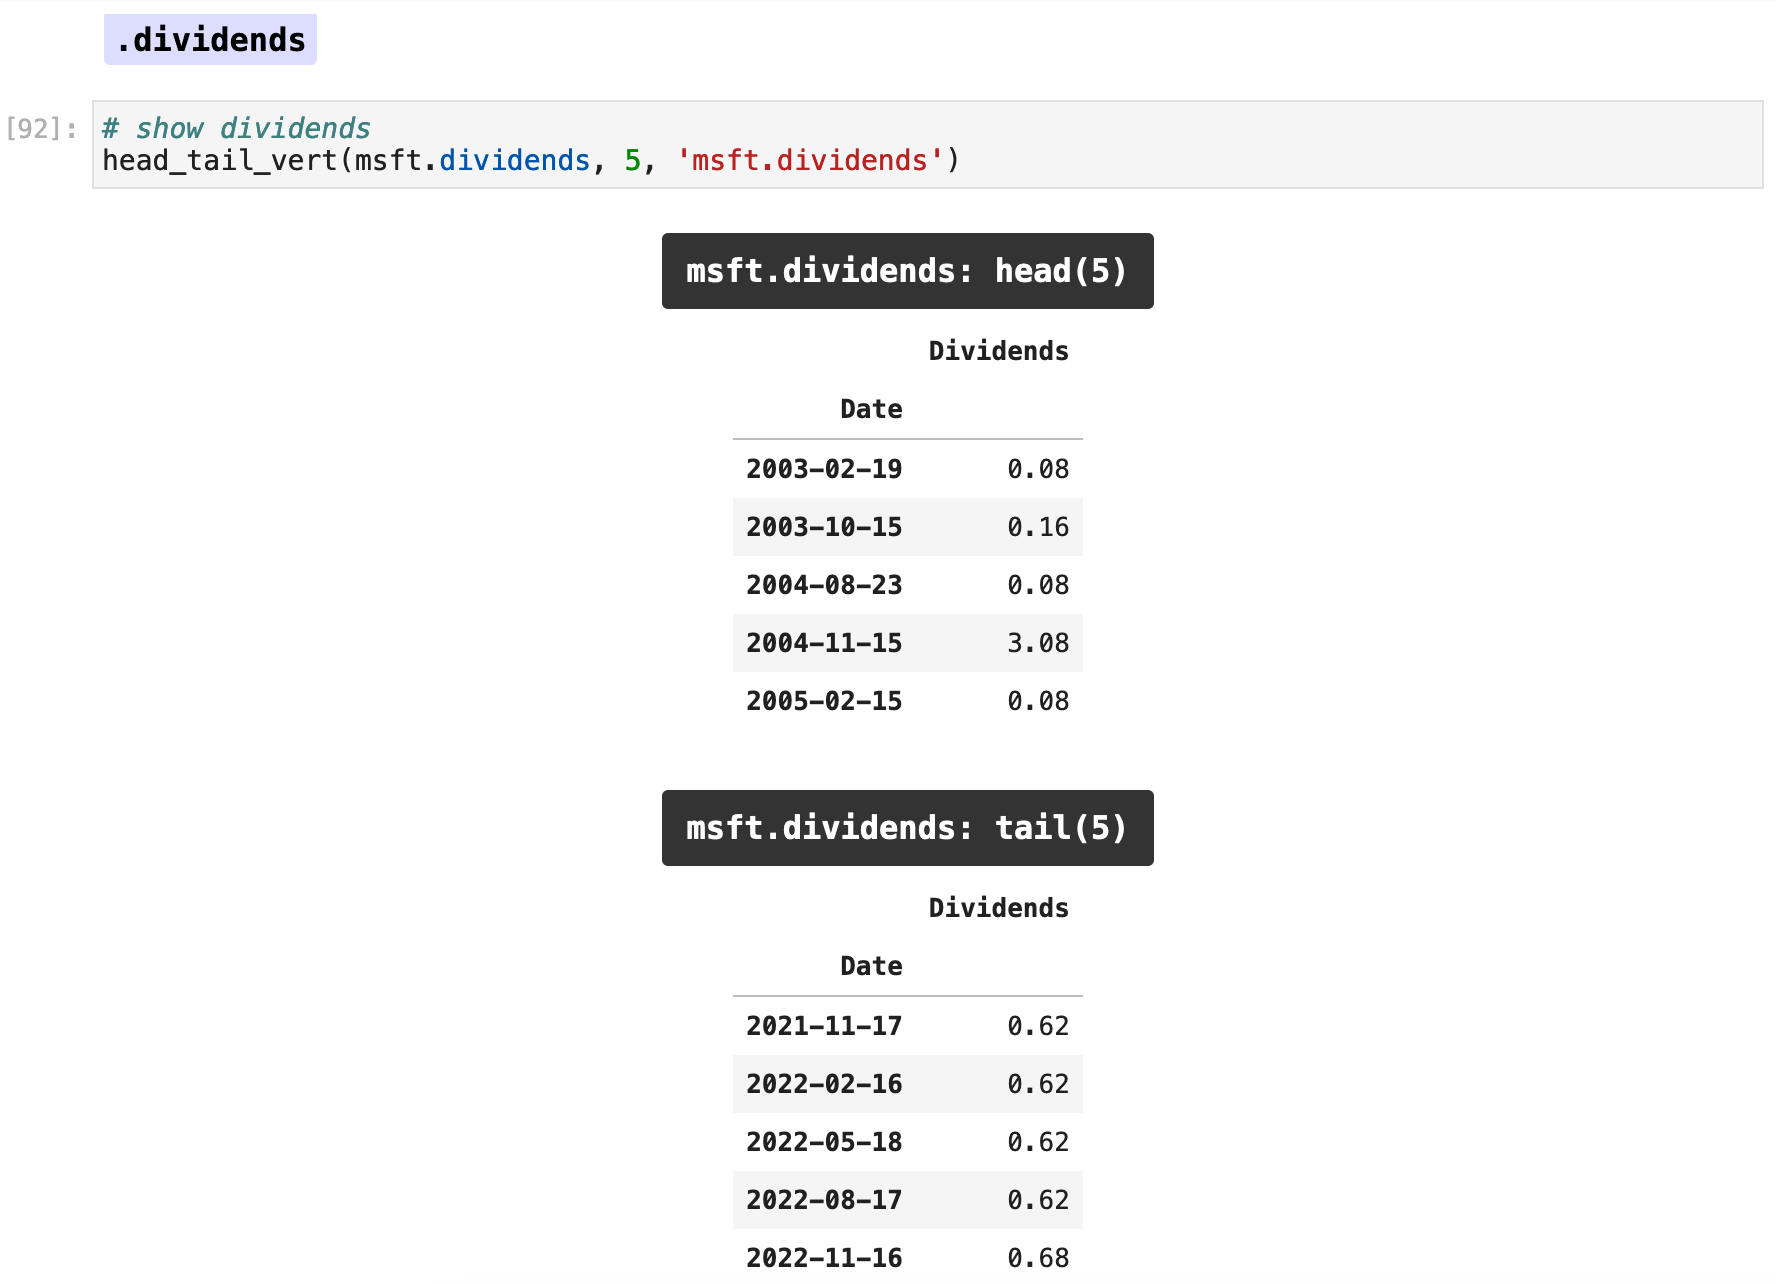
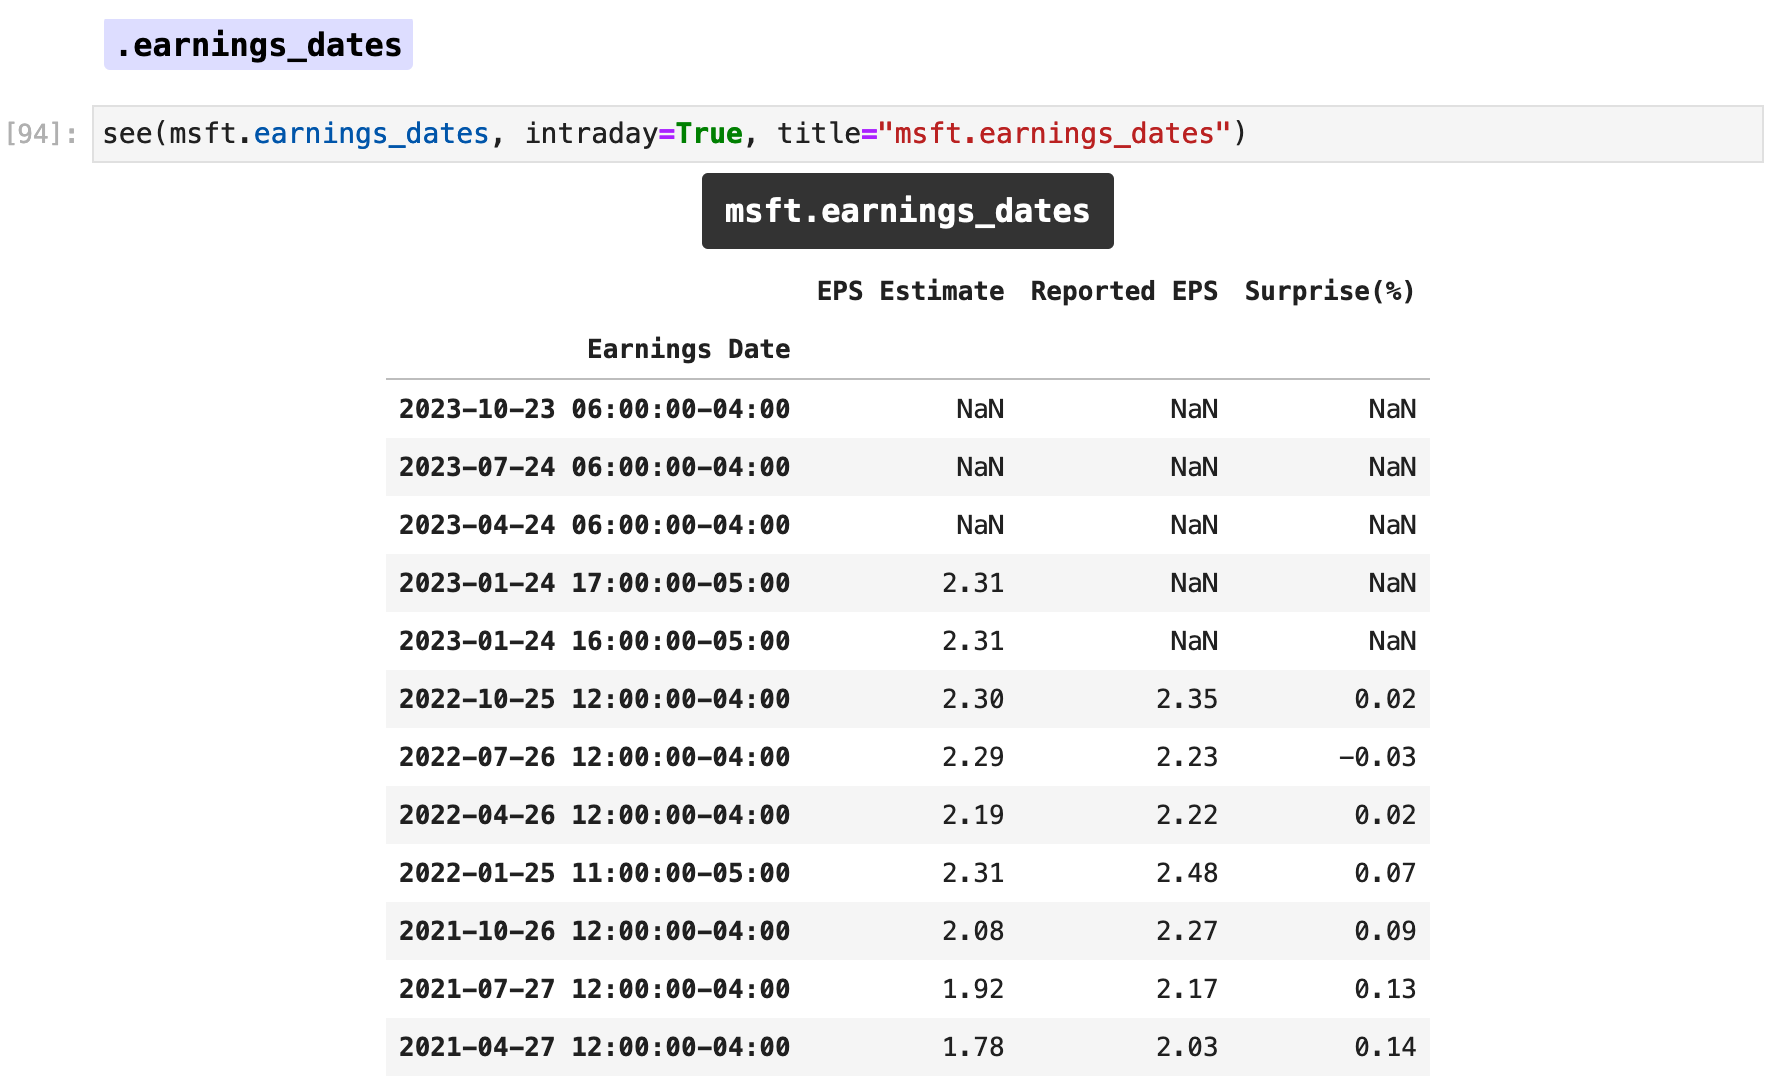
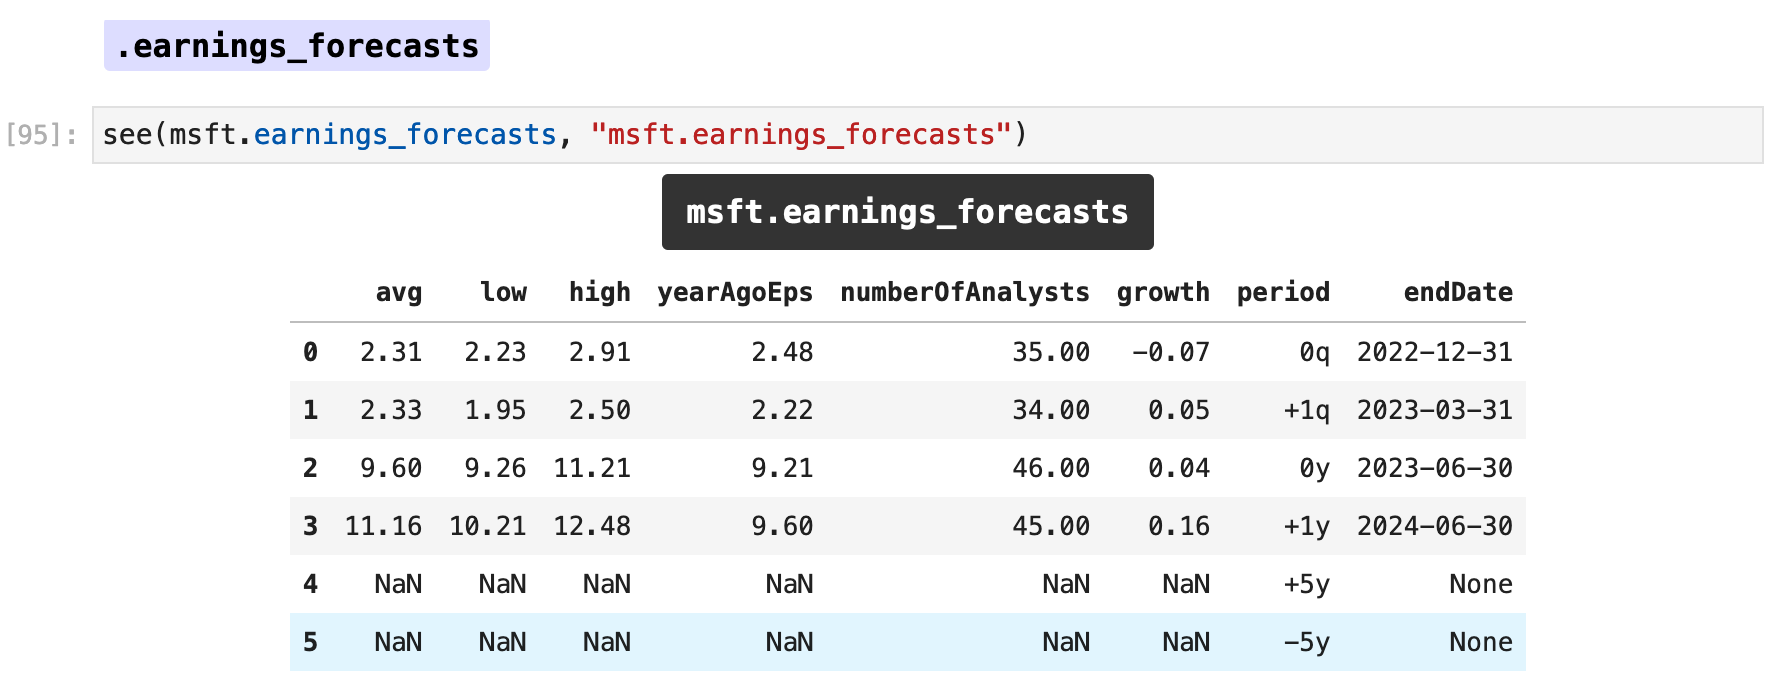
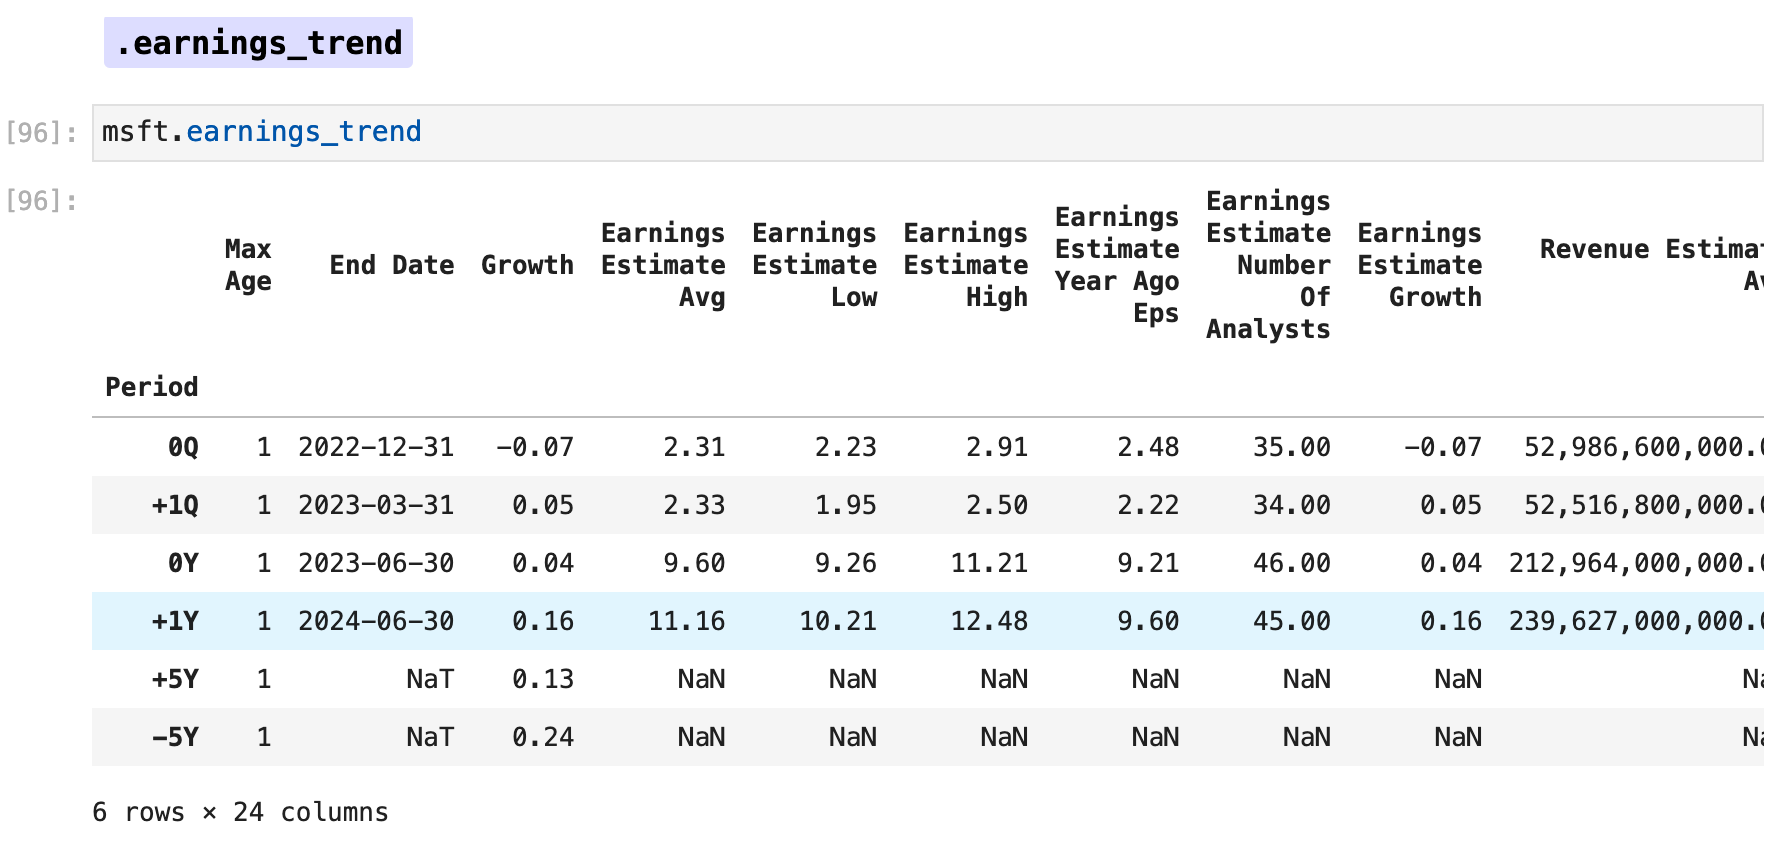
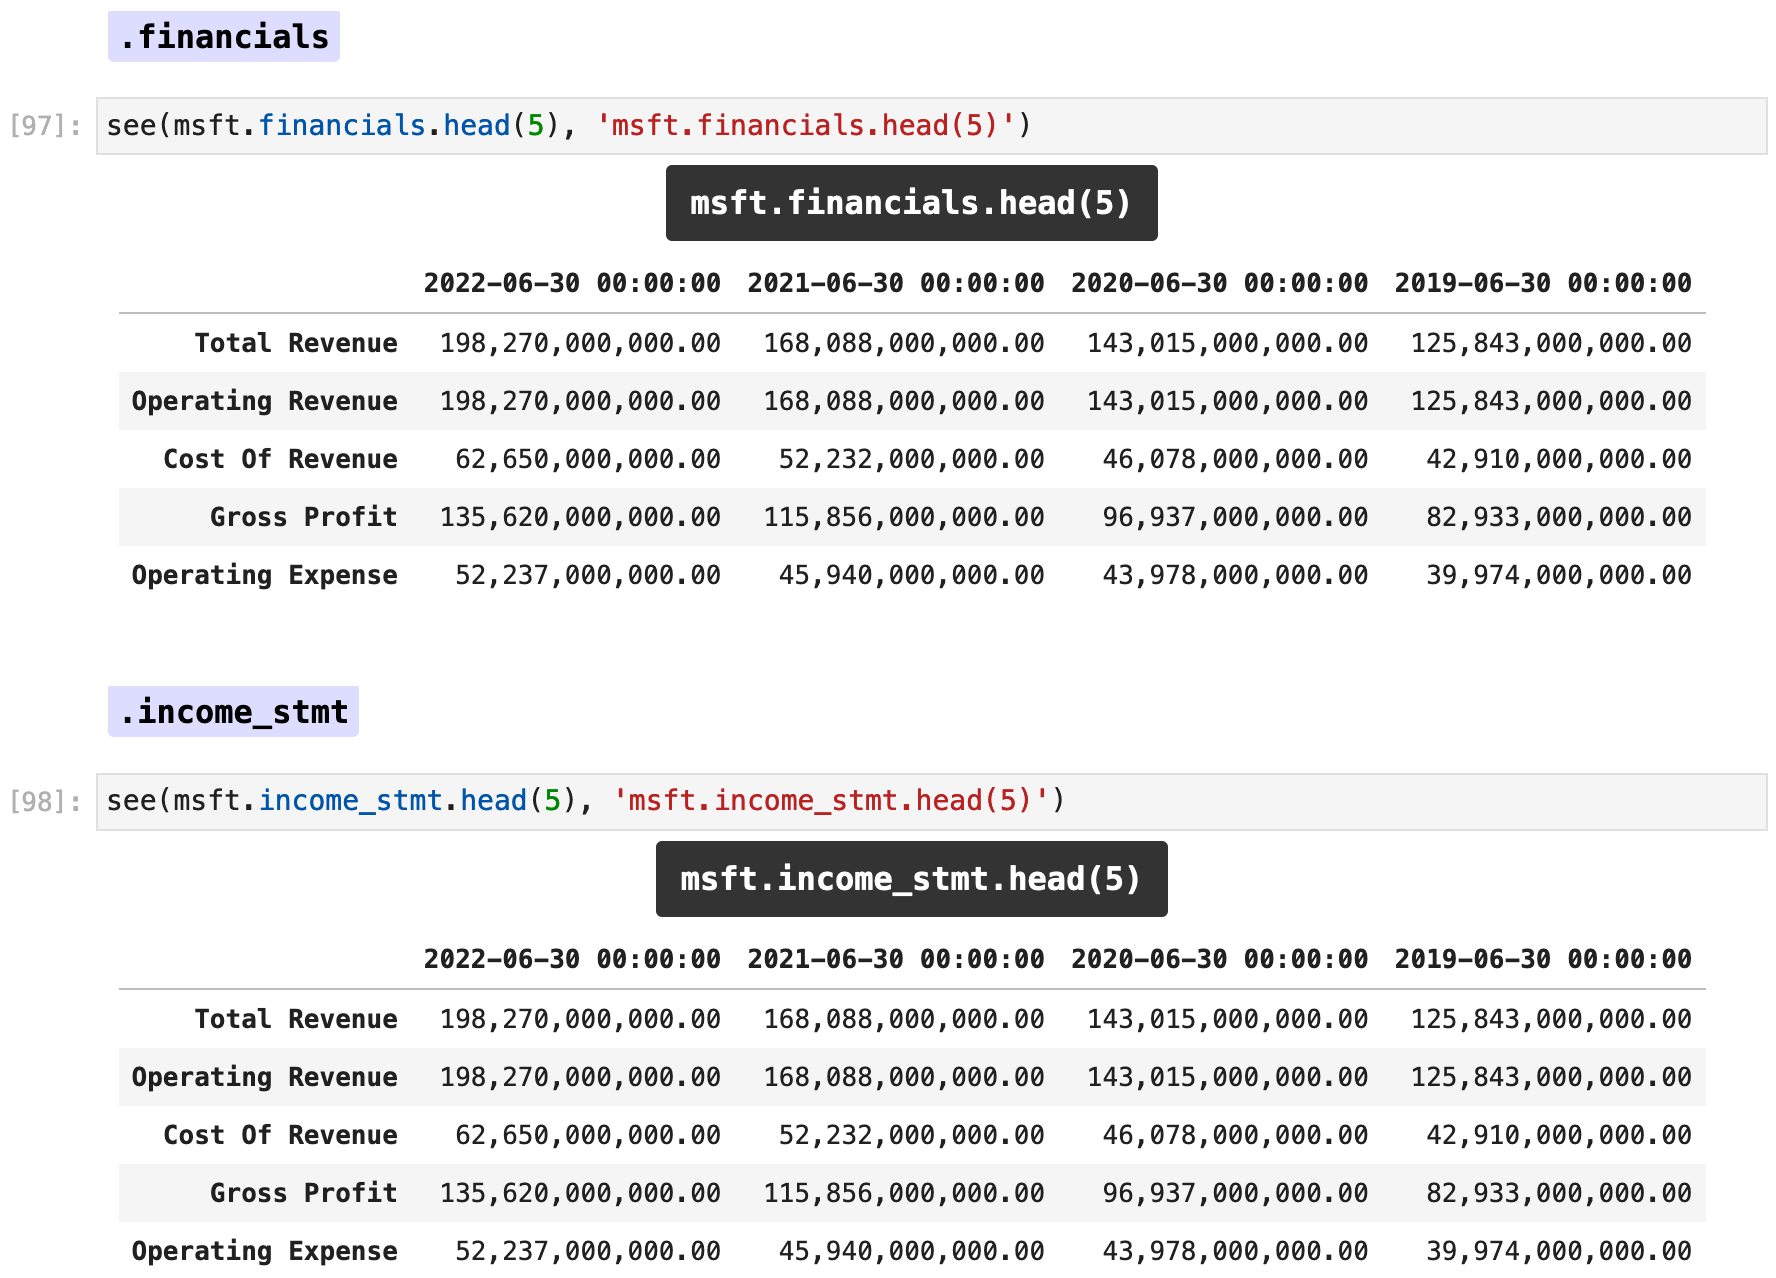
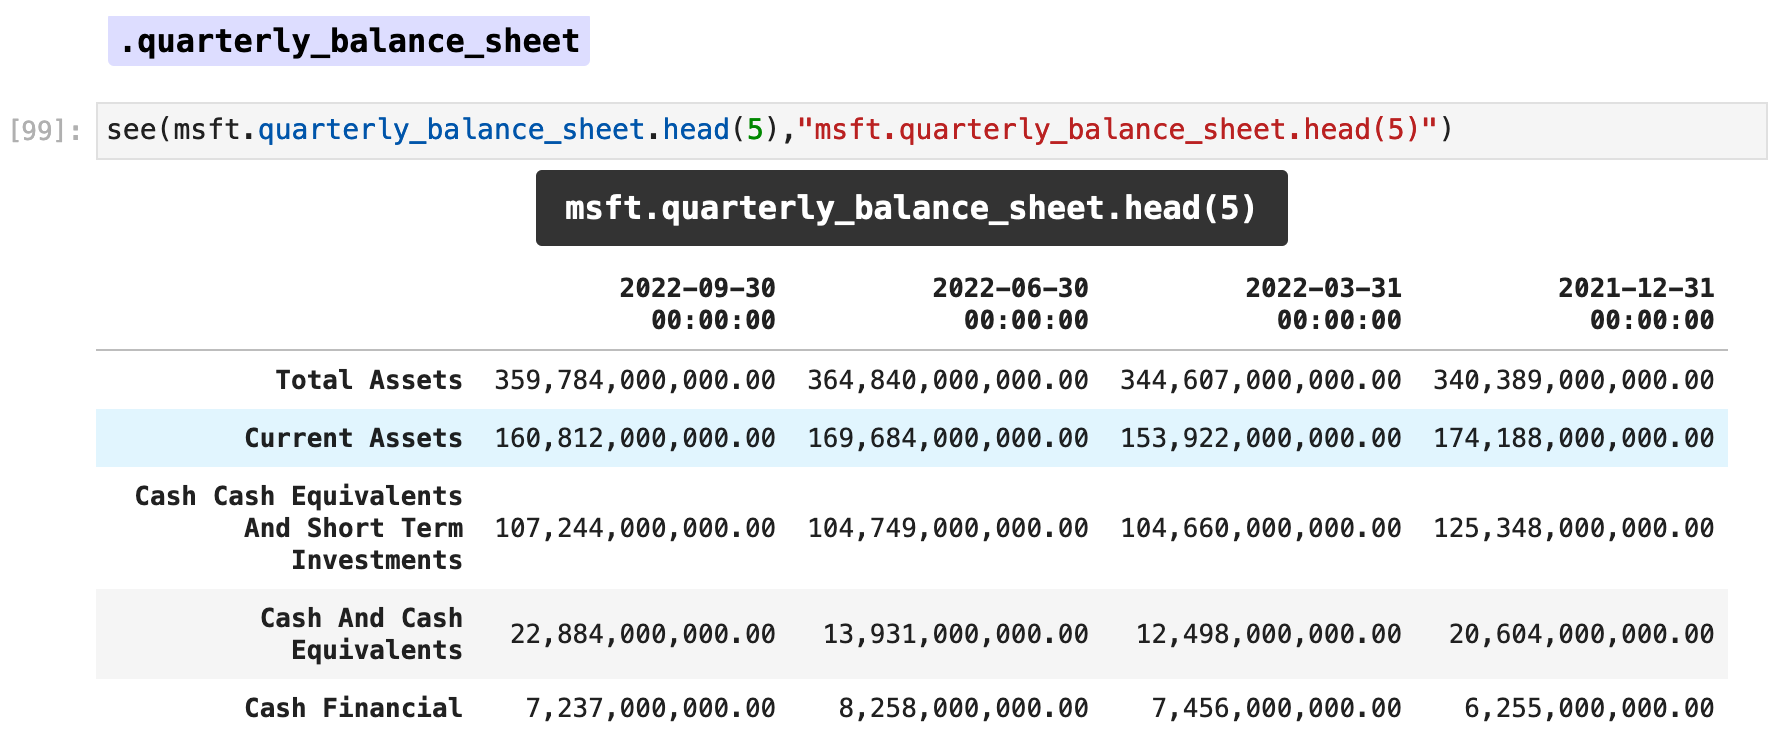
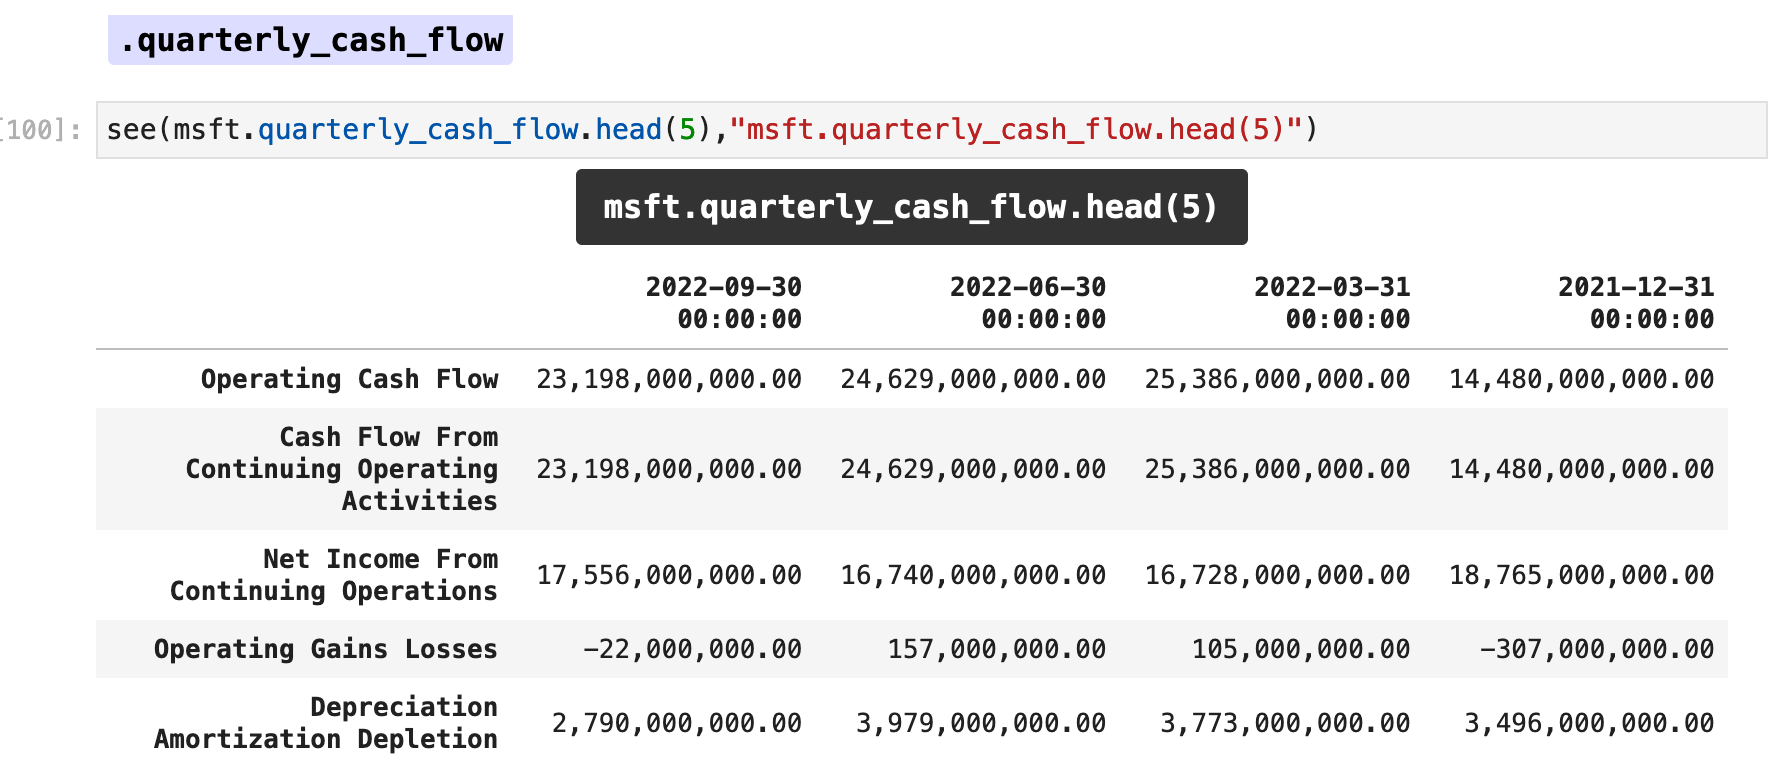
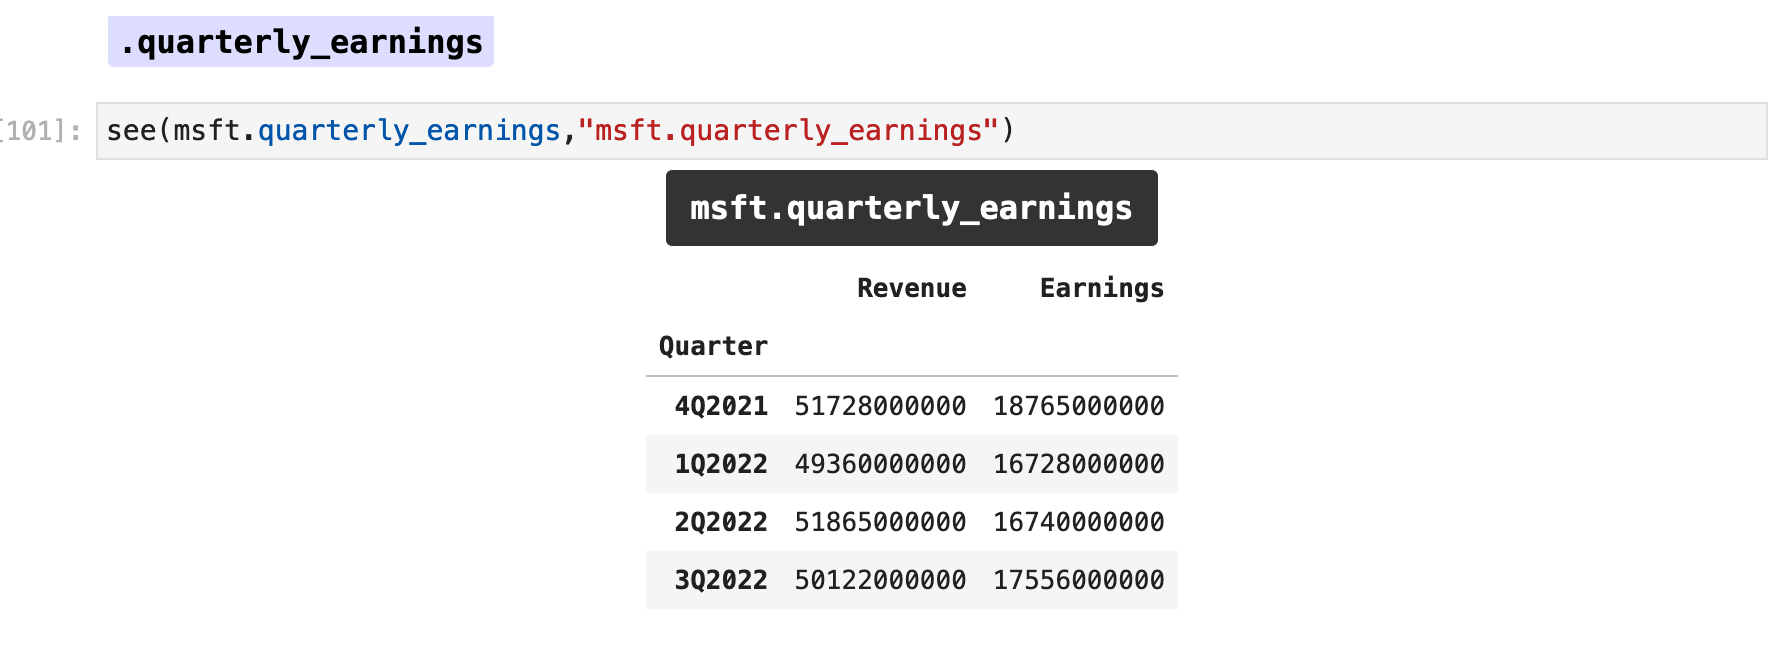
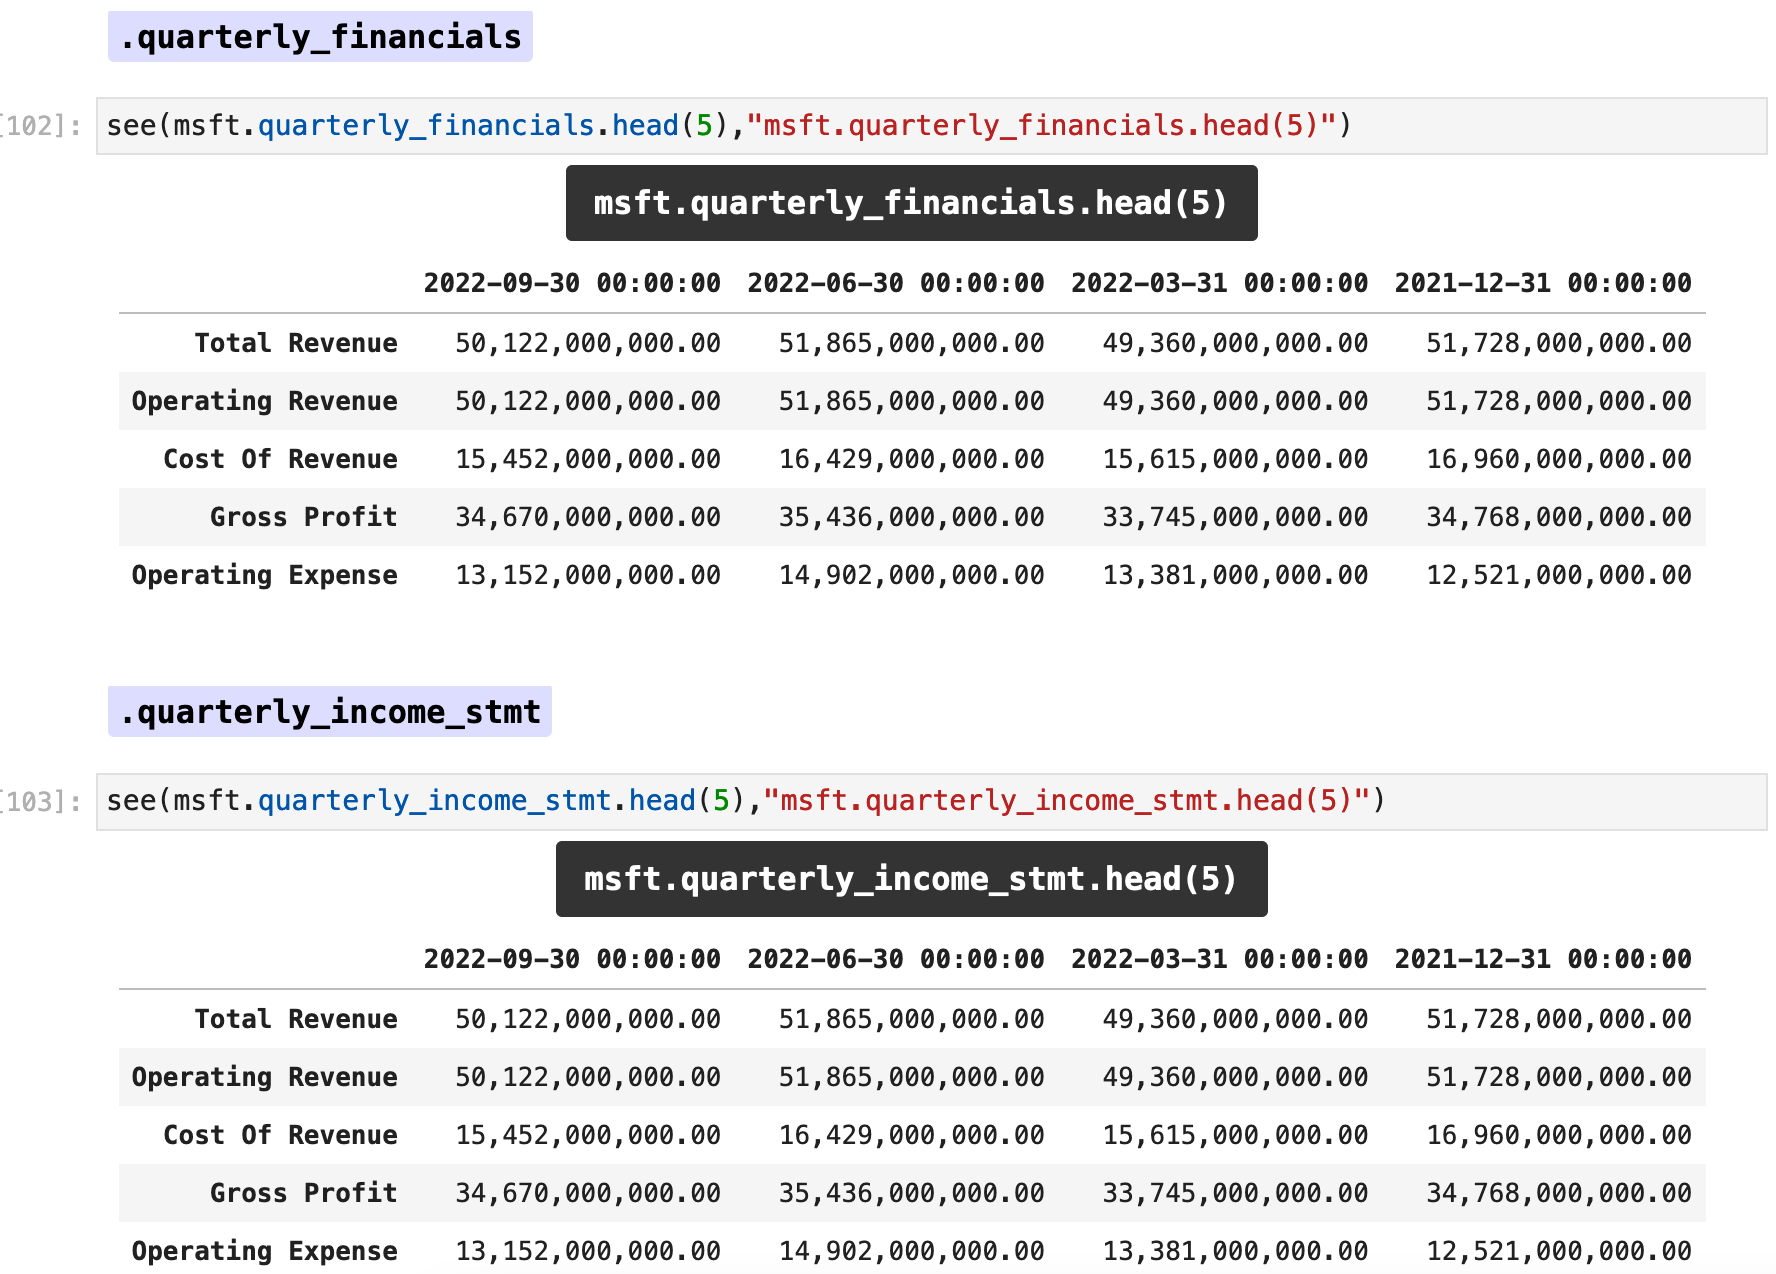
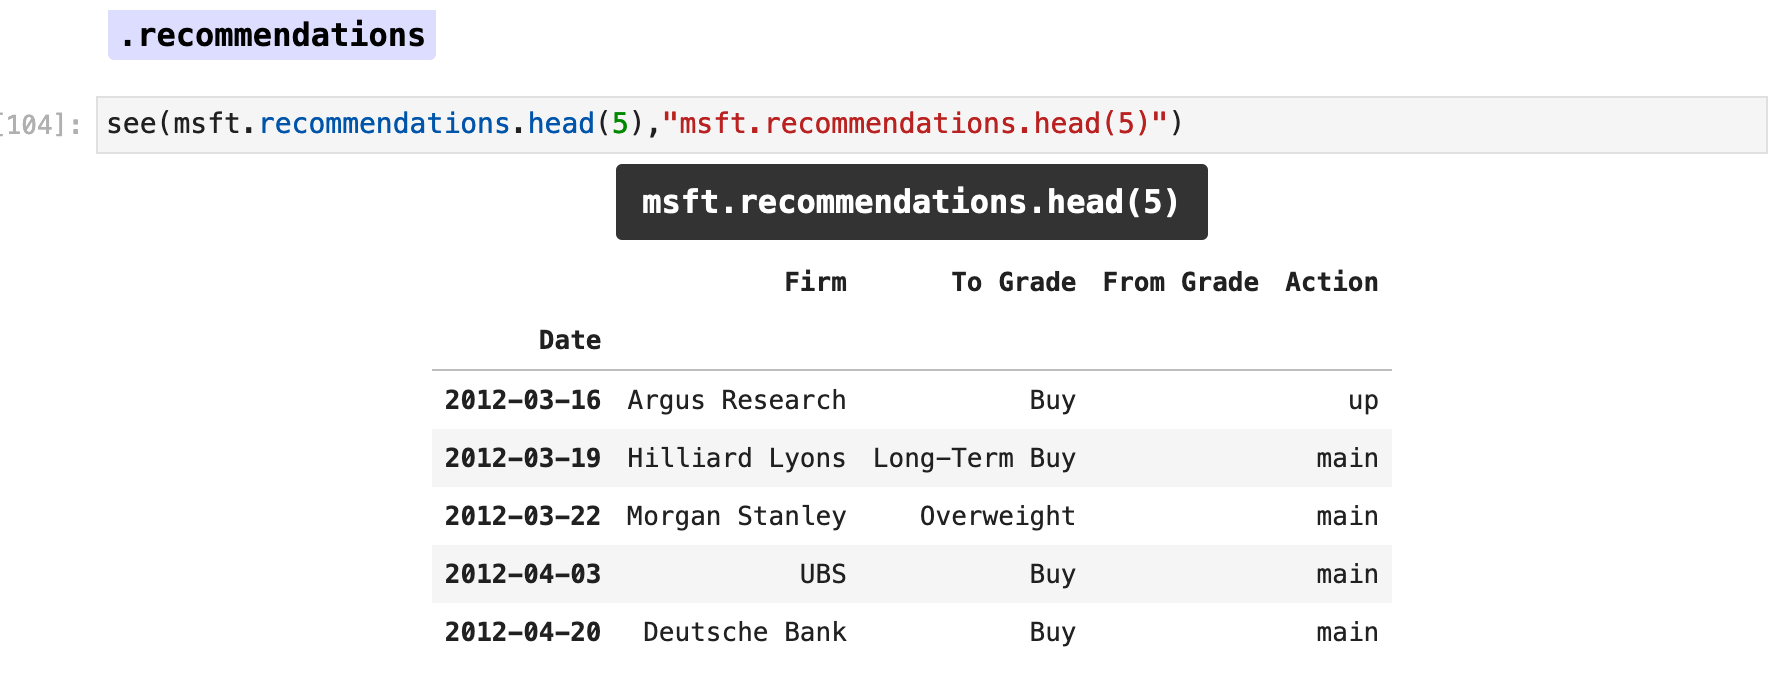
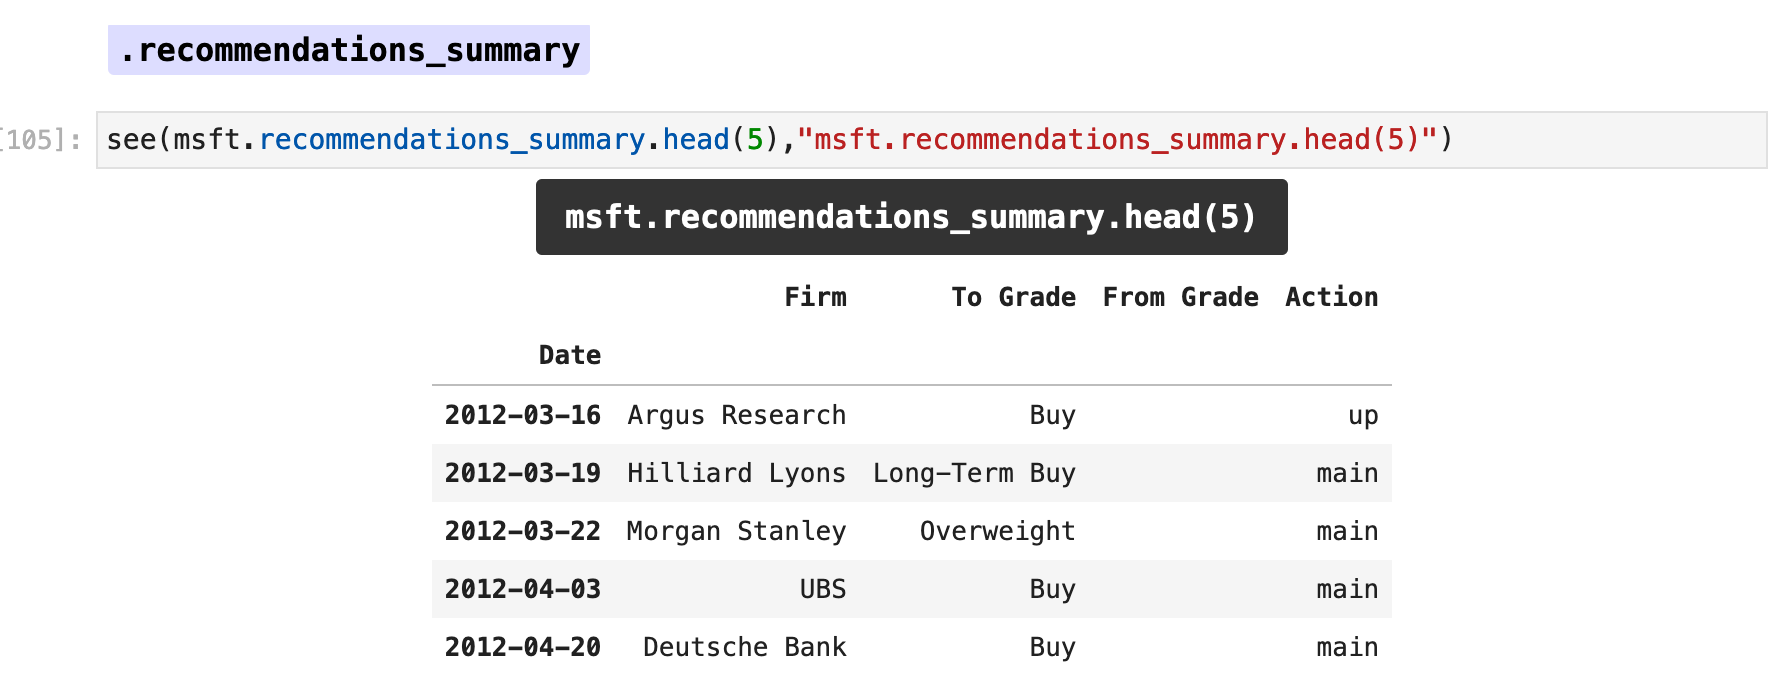
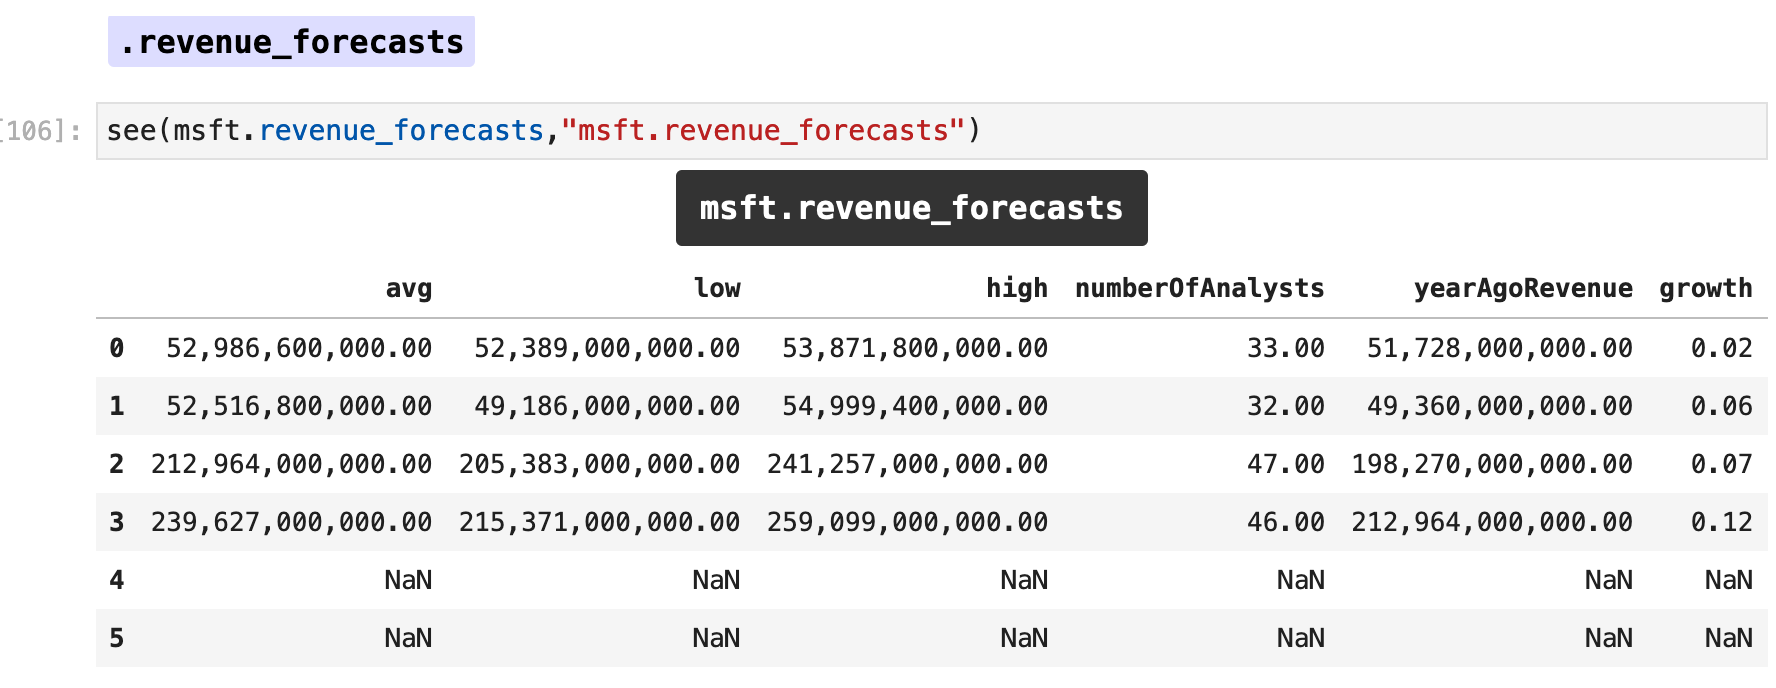
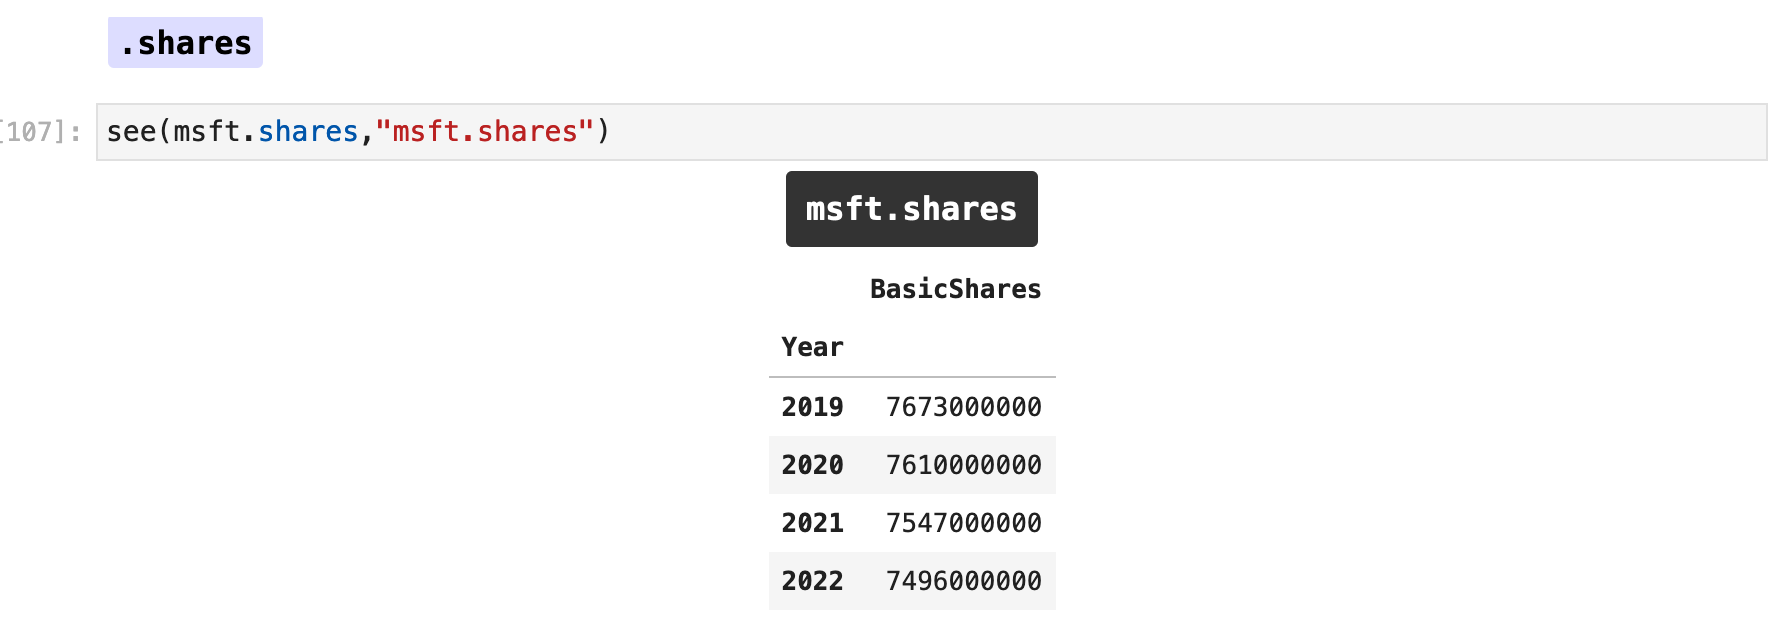
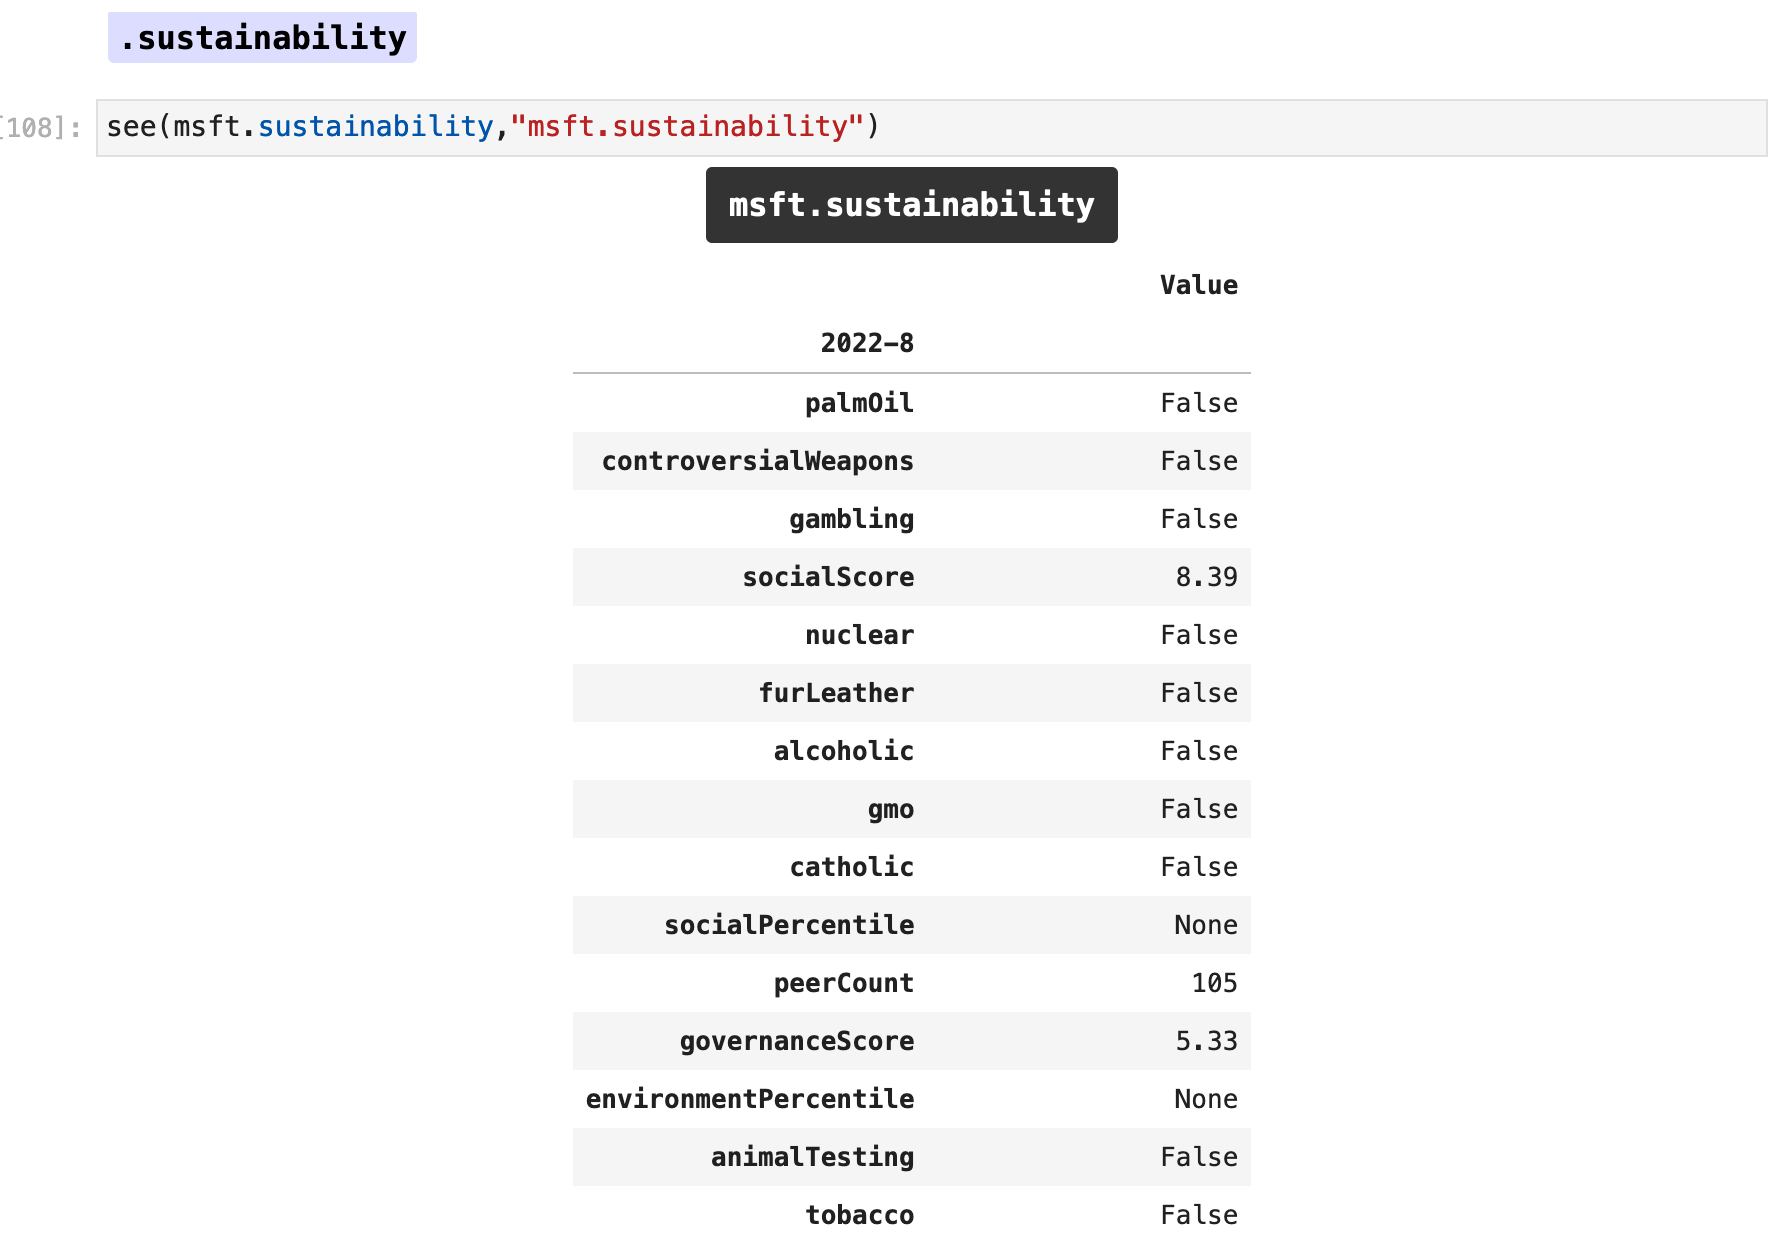
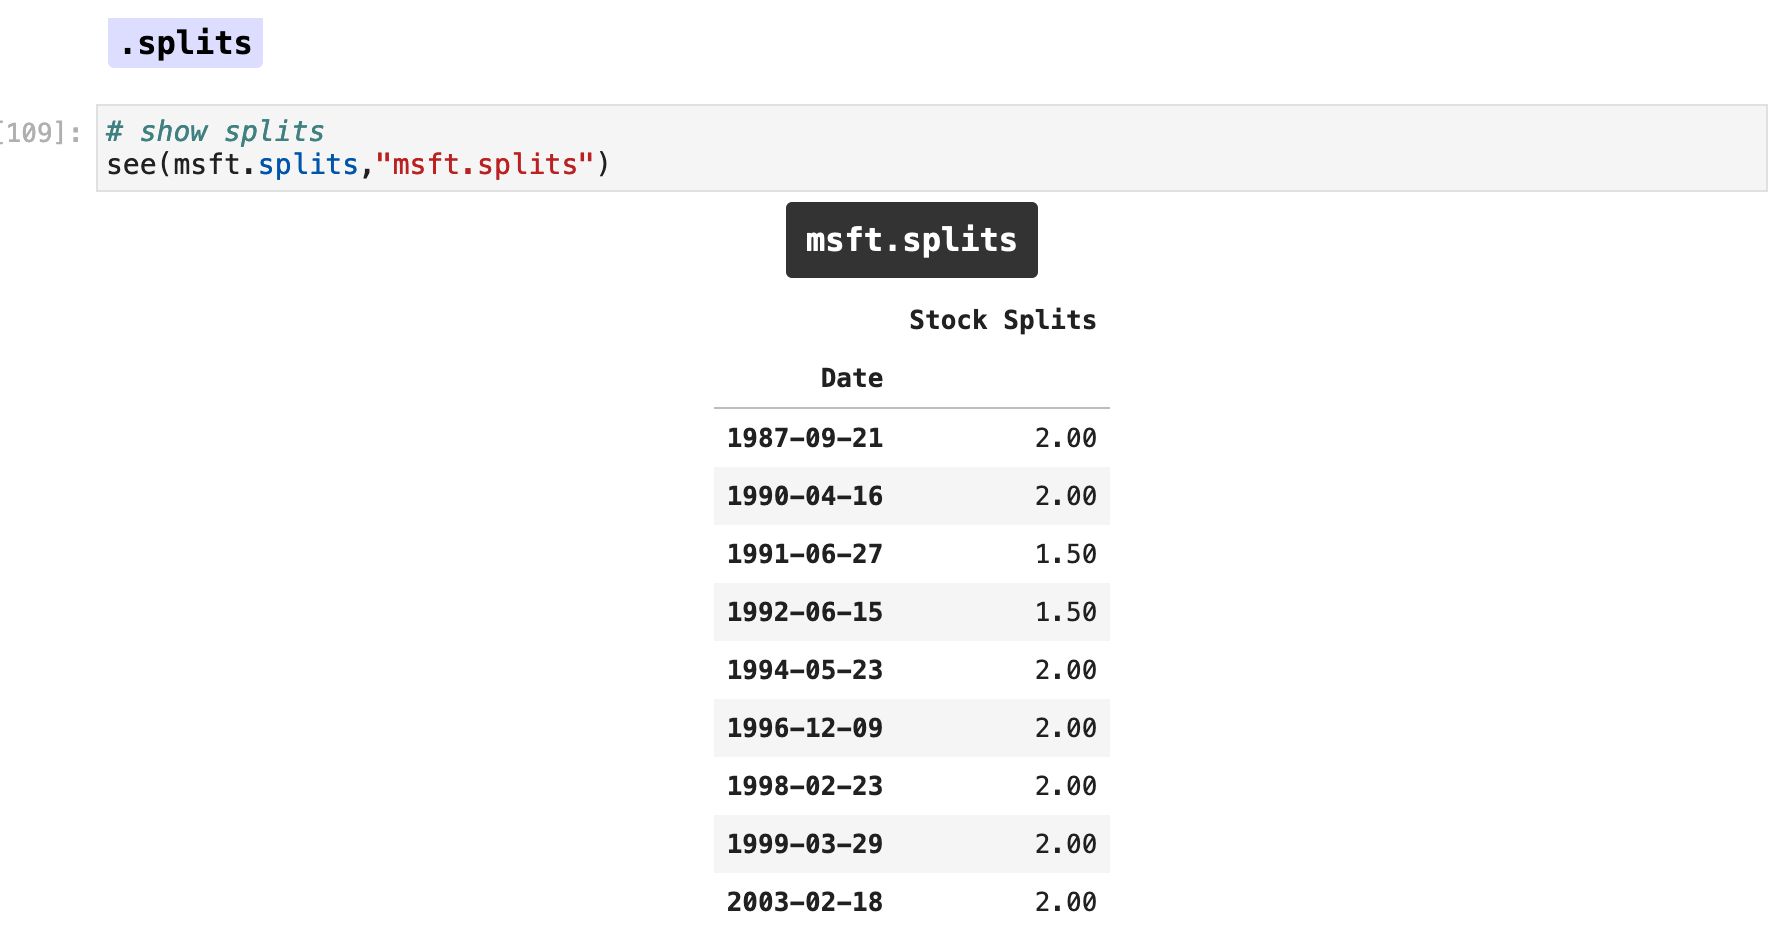
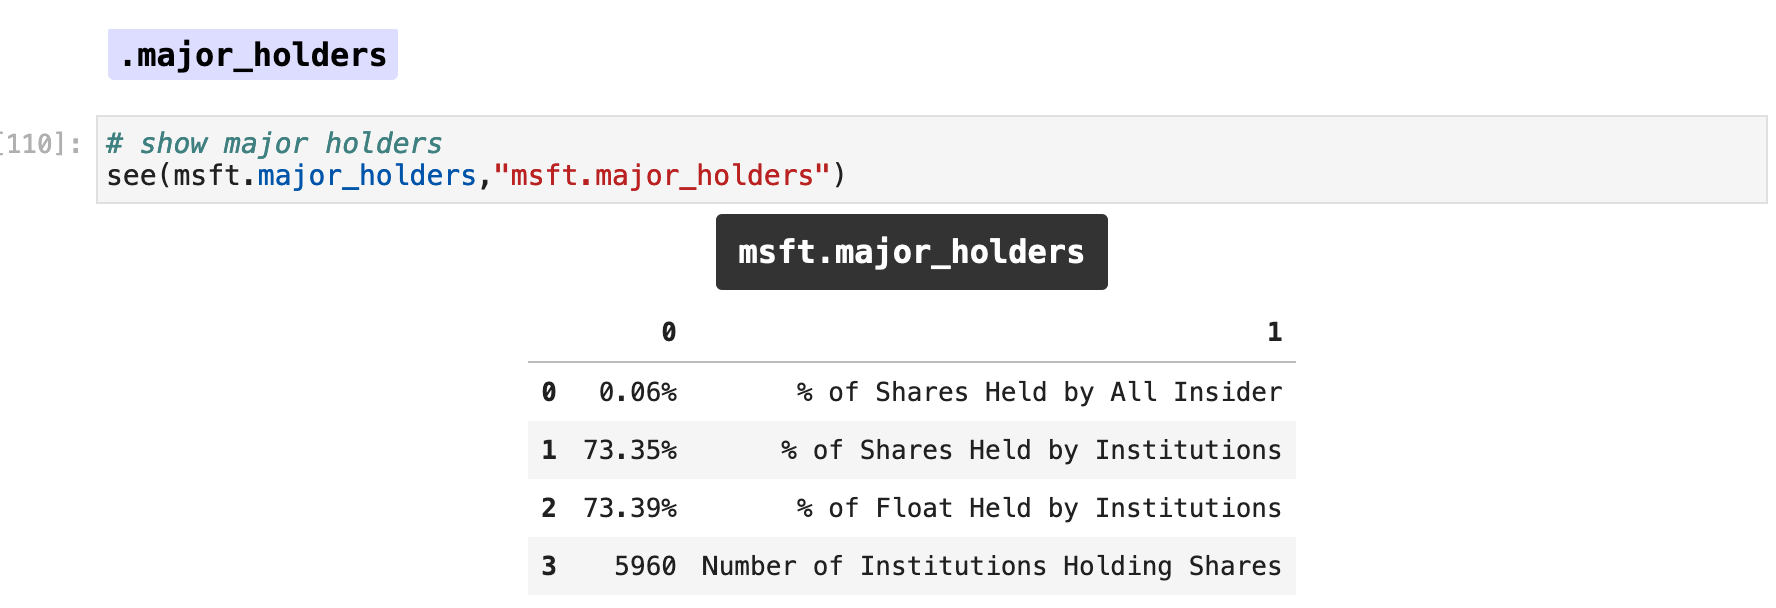
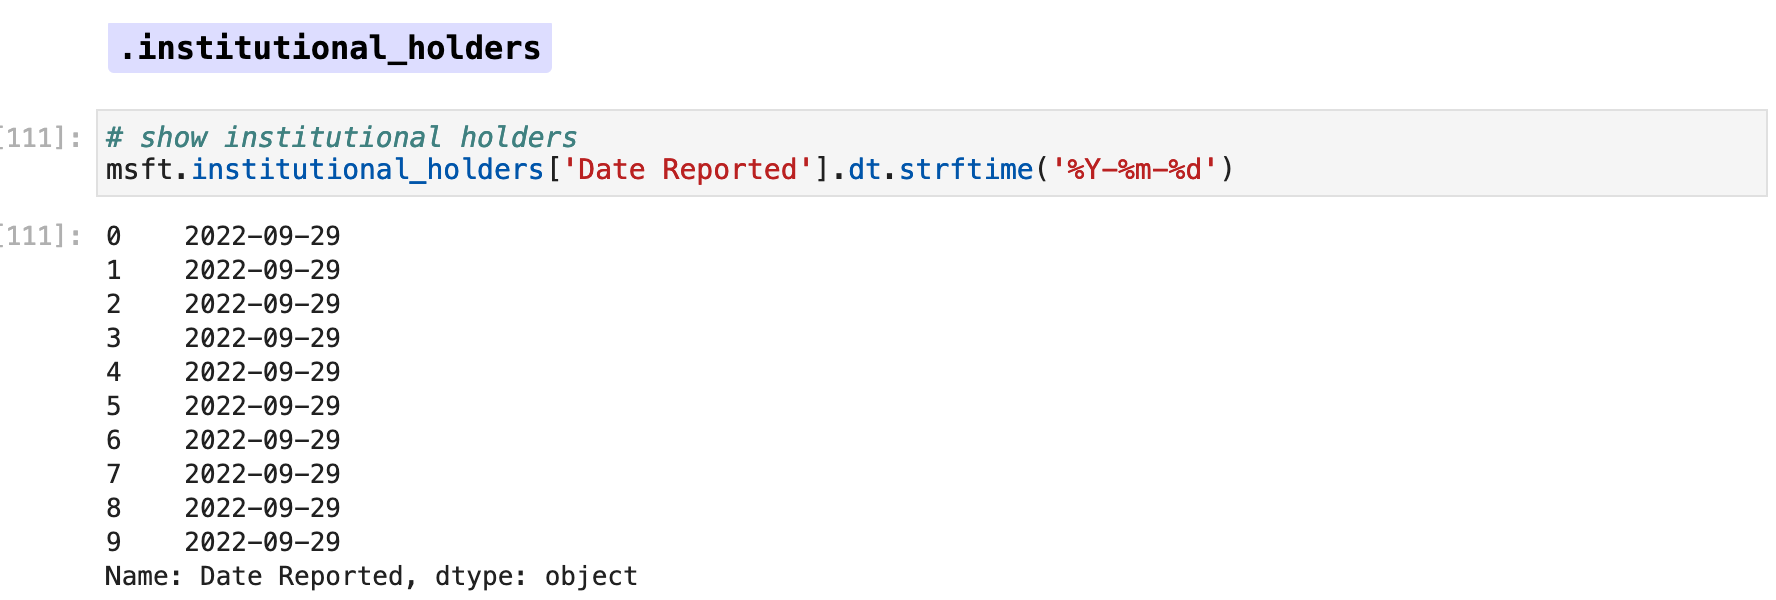
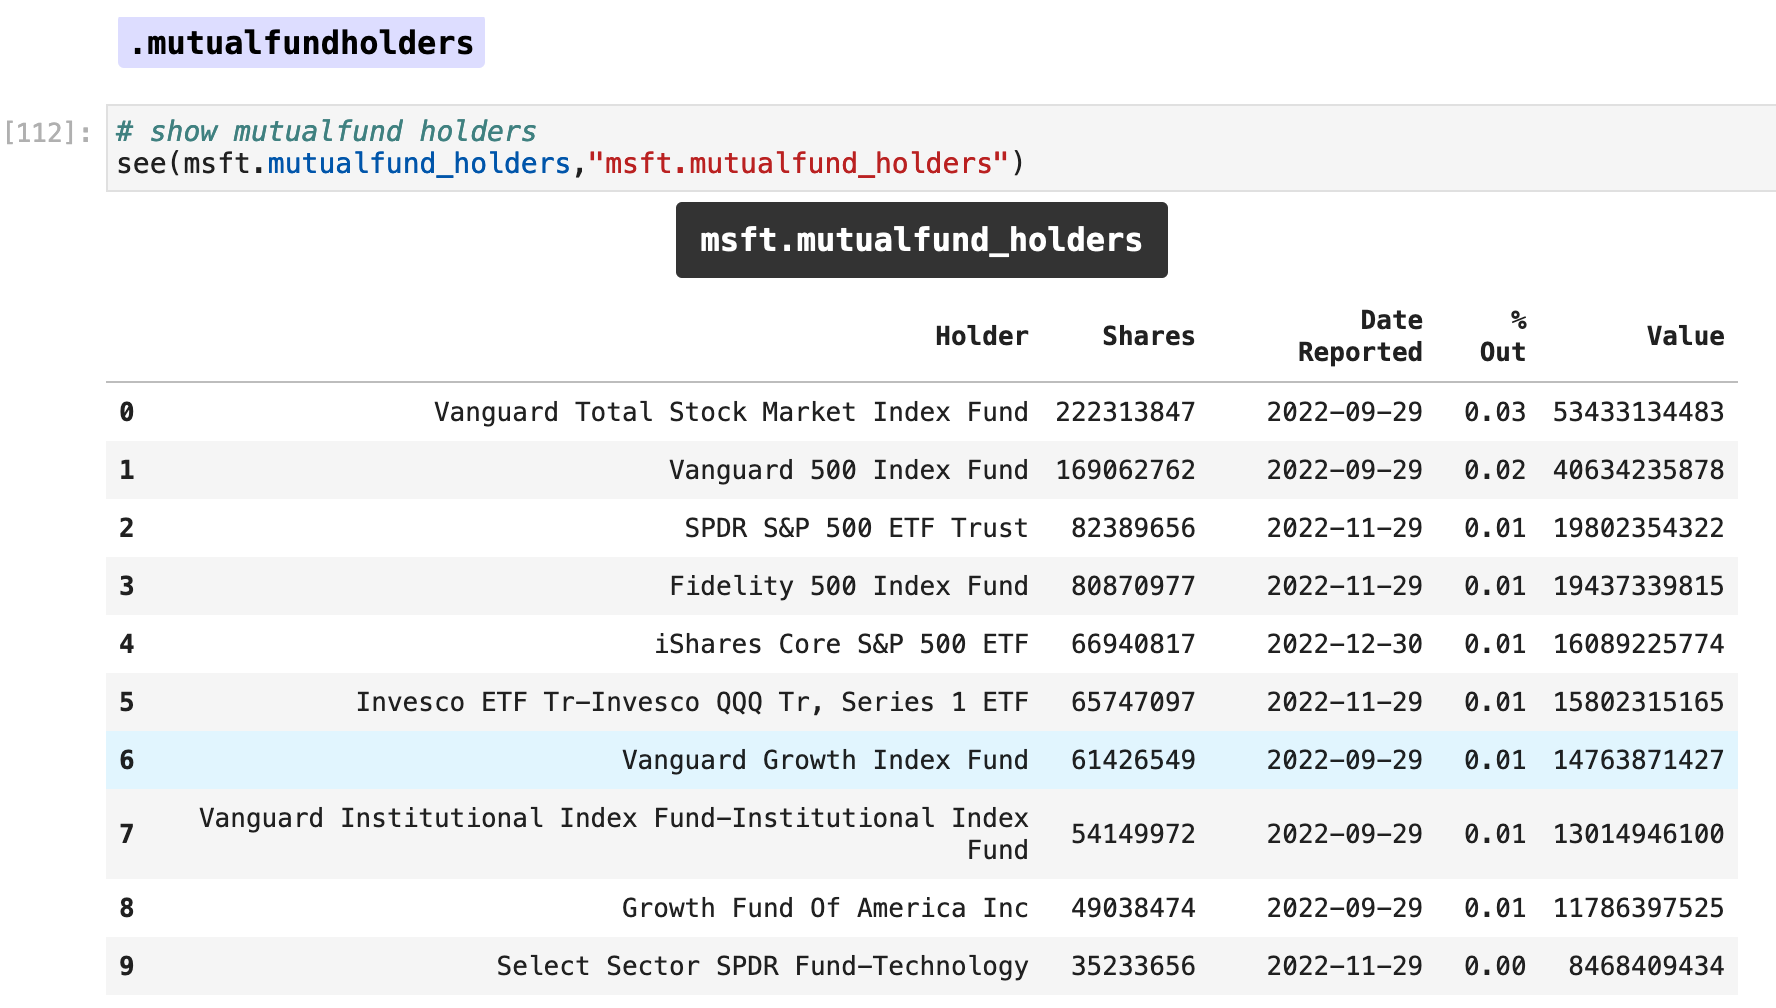
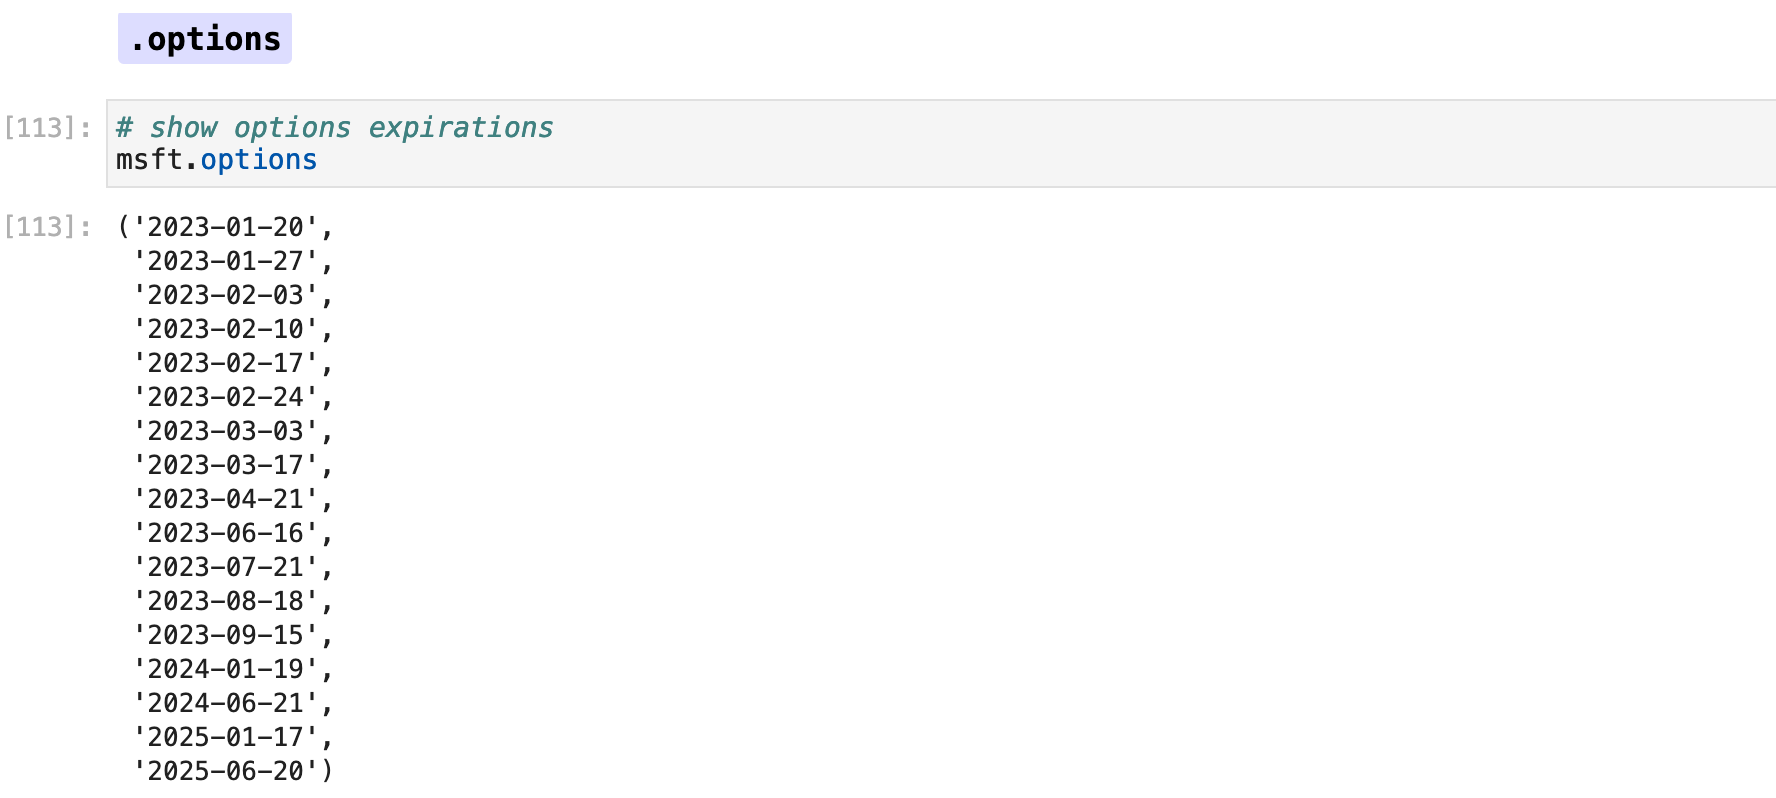
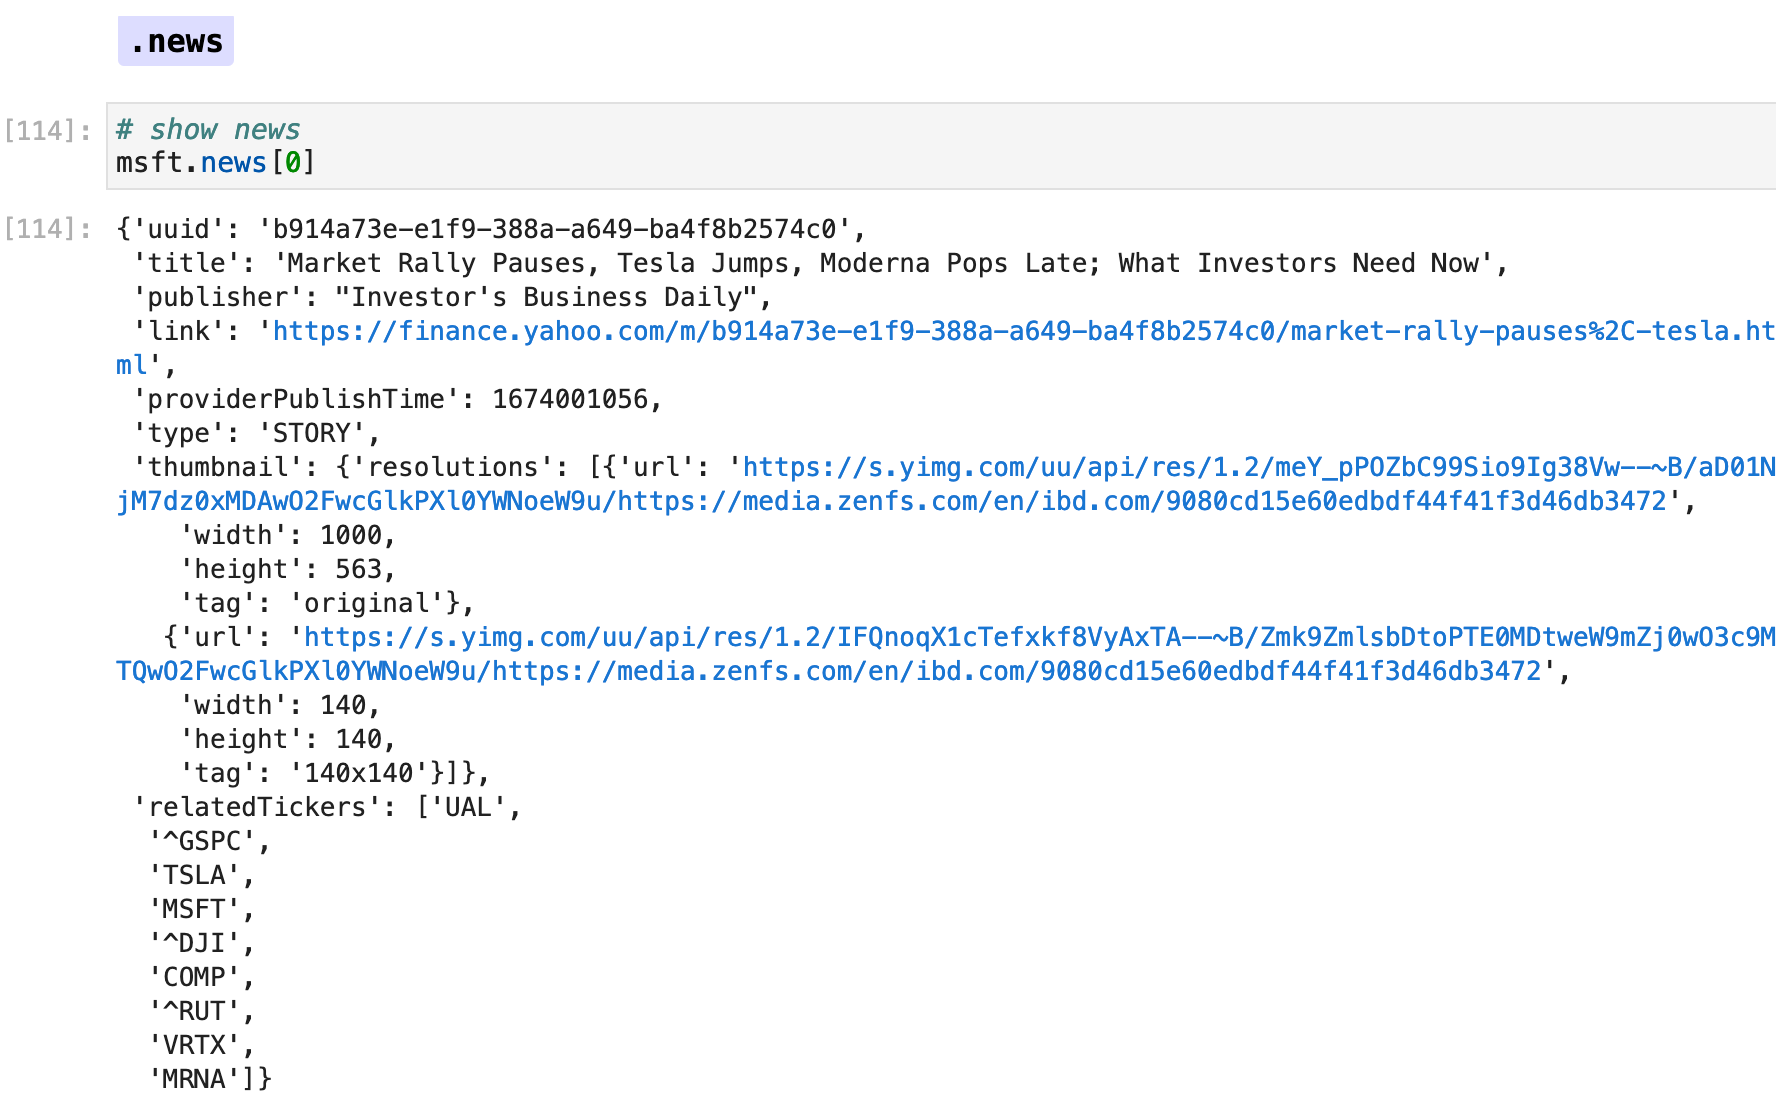
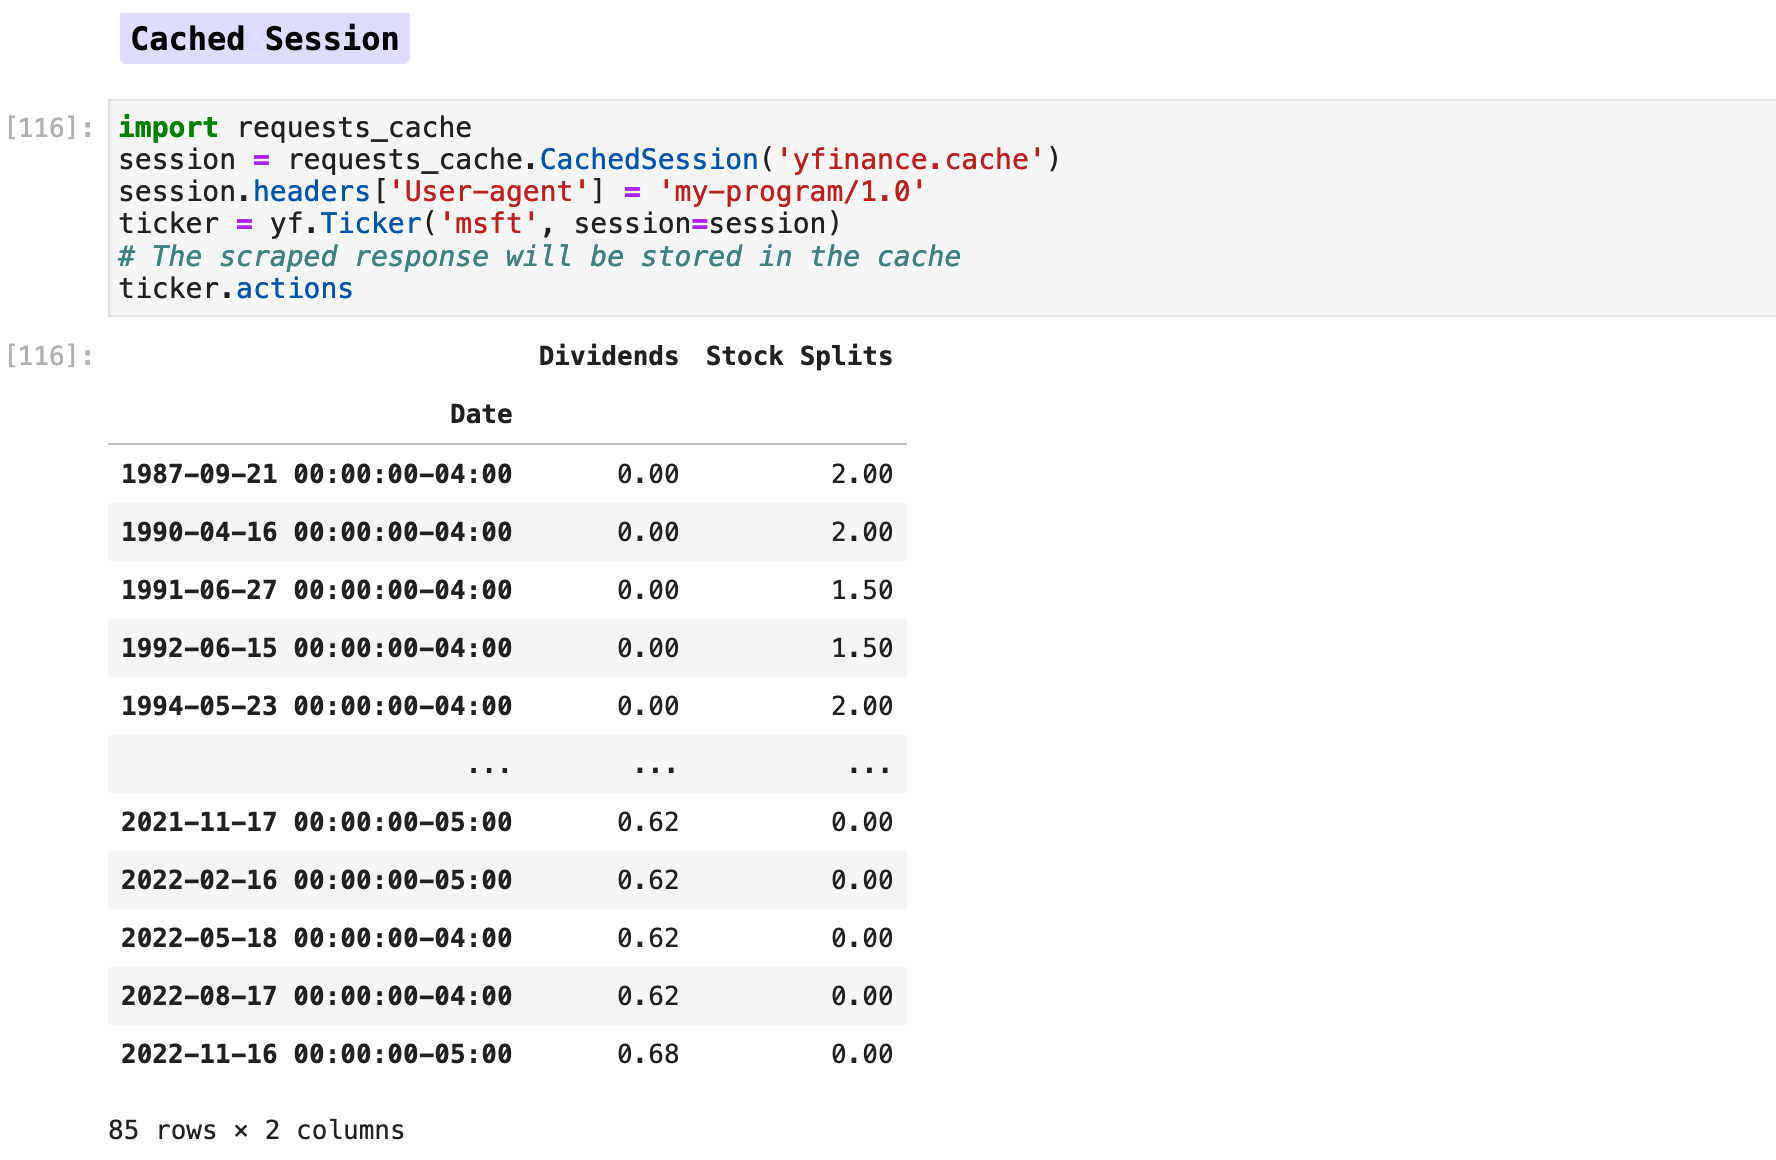
So far, we have looked at data retrieved by using the yf.download() method. Another way we can get even more information about the individual companies and accounts is by using the Ticker object with yfinance. Below is an explanation of the types of data we can acquire this way. And for the remainder of this article, we will be investigating these forms of data.
Many of the following examples and commented explantions come directly from the YFinance documentation, so be sure to investigate the library further for more information. This is an extensive list of functions available. We will investigate the most useful ones further in the next sections of this article.
Also note that I have condensed the output of many functions, since they often return many pages of data. So keep in mind that you are able to retrieve far more than the excerpts here show. This is just the tip of the proverbial iceberg.


Sections: ● Top ● Historical Data ● Setting Date Range ● High Frenquency ● Splits & Dividends ● Exporting ● Multiple Stocks ● Importing Indexes ● Currency Exchange ● Cryptocurrencies ● Mutual & Exchange Traded Funds ● Treasury Yields ● Ticker Object & Docs ● Stock Fundamentals ● Importing Financials ● Importing Put & Call Options ● Streaming Real-Time ●

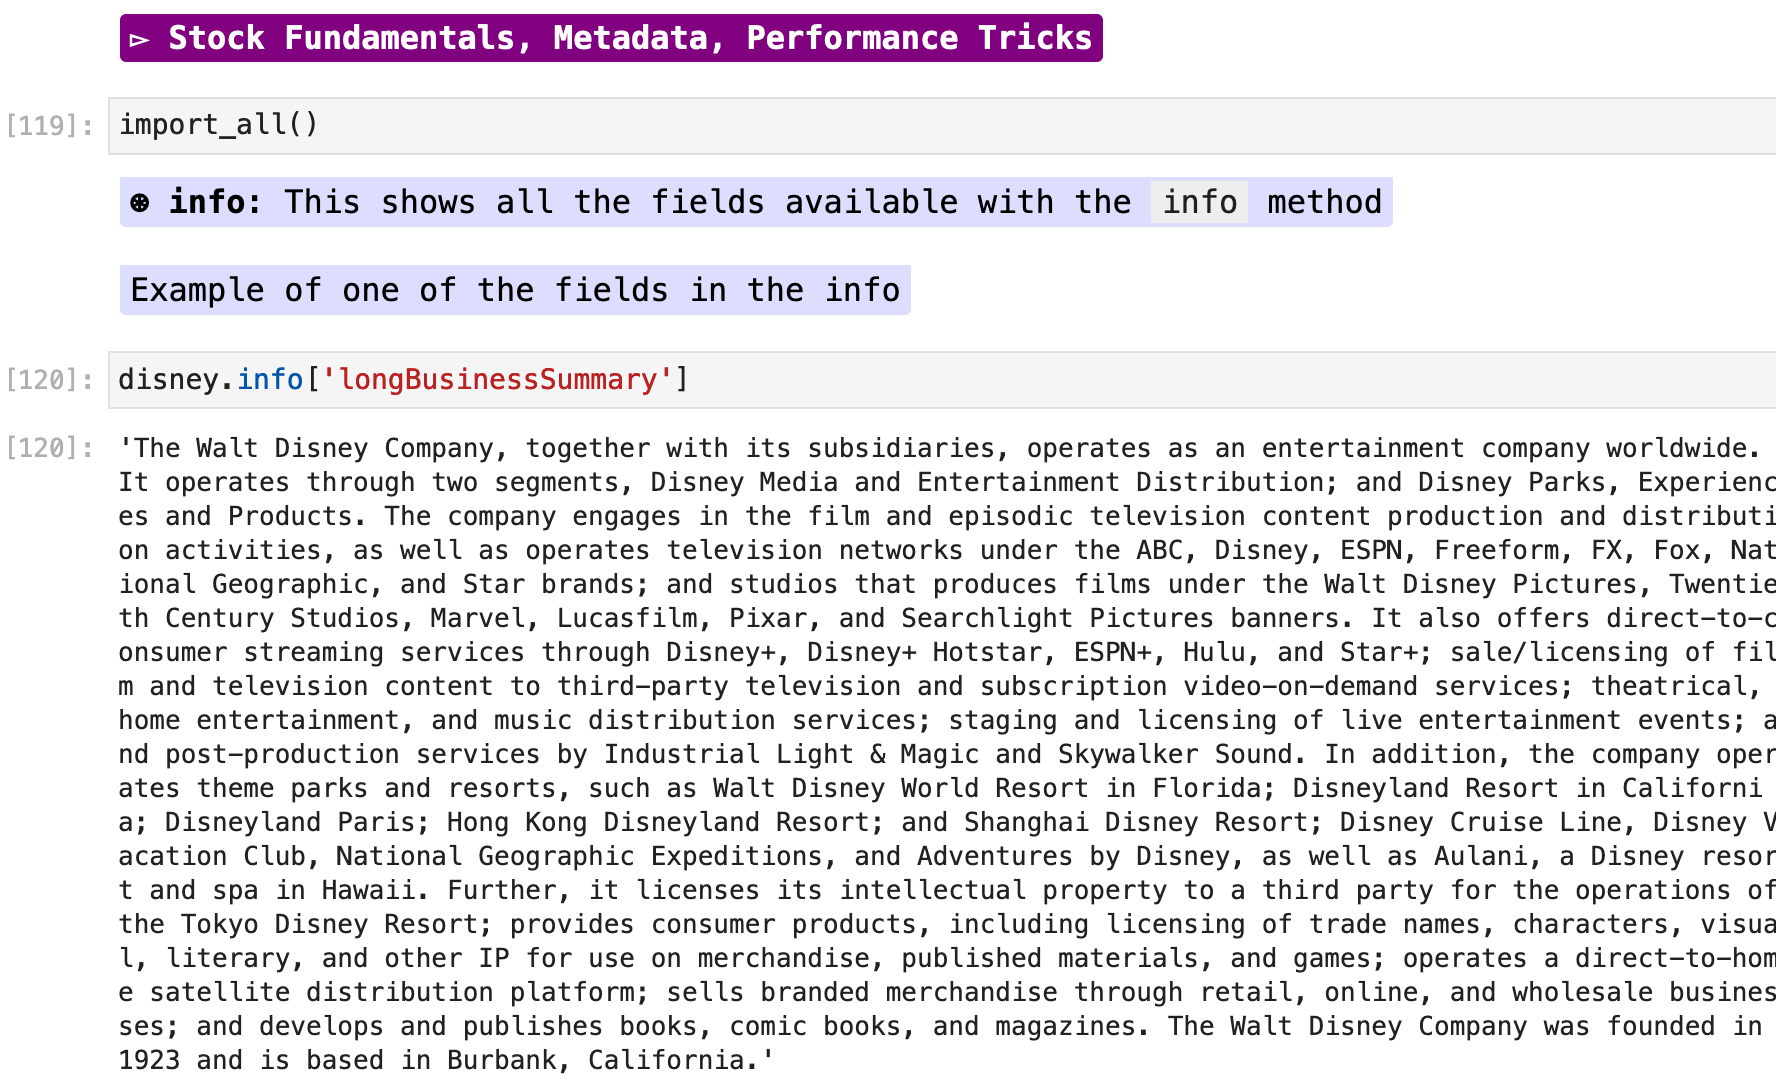
Let’s investigate some of the methods of retrieving company data shown above even further. We will start with the .info attribute, which returns over 154 fields of data for any given ticker symbol. I have chosen to output specific parts of the data for examples. In the first, we see the data stored in the longBusinessSummary field for the ticker "DIS", which is the Disney company.
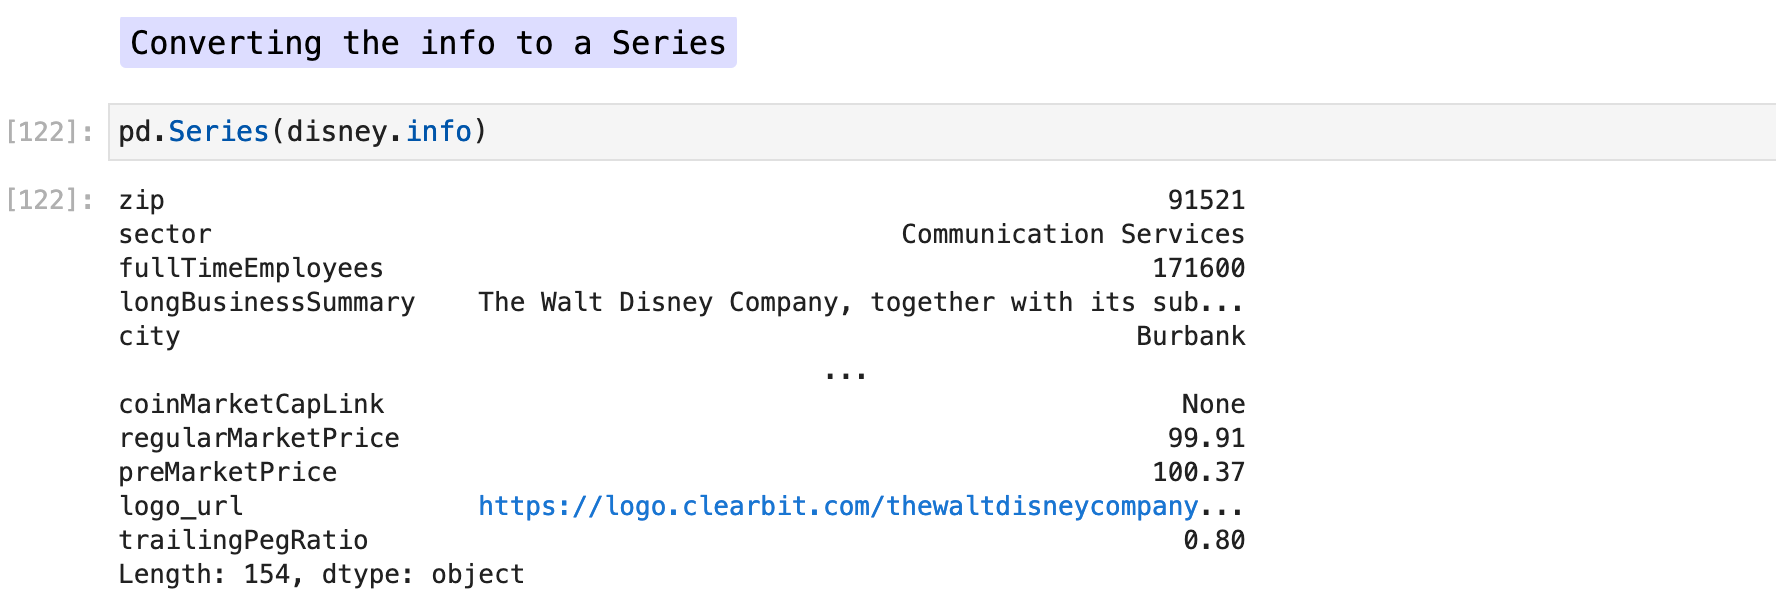
The data returned by the .info attribute can be easily converted into a Pandas series object.
Here, I have written a function that takes a list of ticker symbols and compiles all the data from the TickerObject.info for each symbol as a combined dataframe. For my example ticker list, I chose to retrieve Yahoo Finance’s daily “trending stocks” from their website, using pd.read_html(). This way, I import the tabular data from the html link passed and can convert the symbols from the table into a list that can be fed into the company_info_dataframer() function.
I have also reformatted the % Change column from the data I retrieved from the Yahoo Finance website so that it is numerical and can therefore serve as a means of sorting the data.
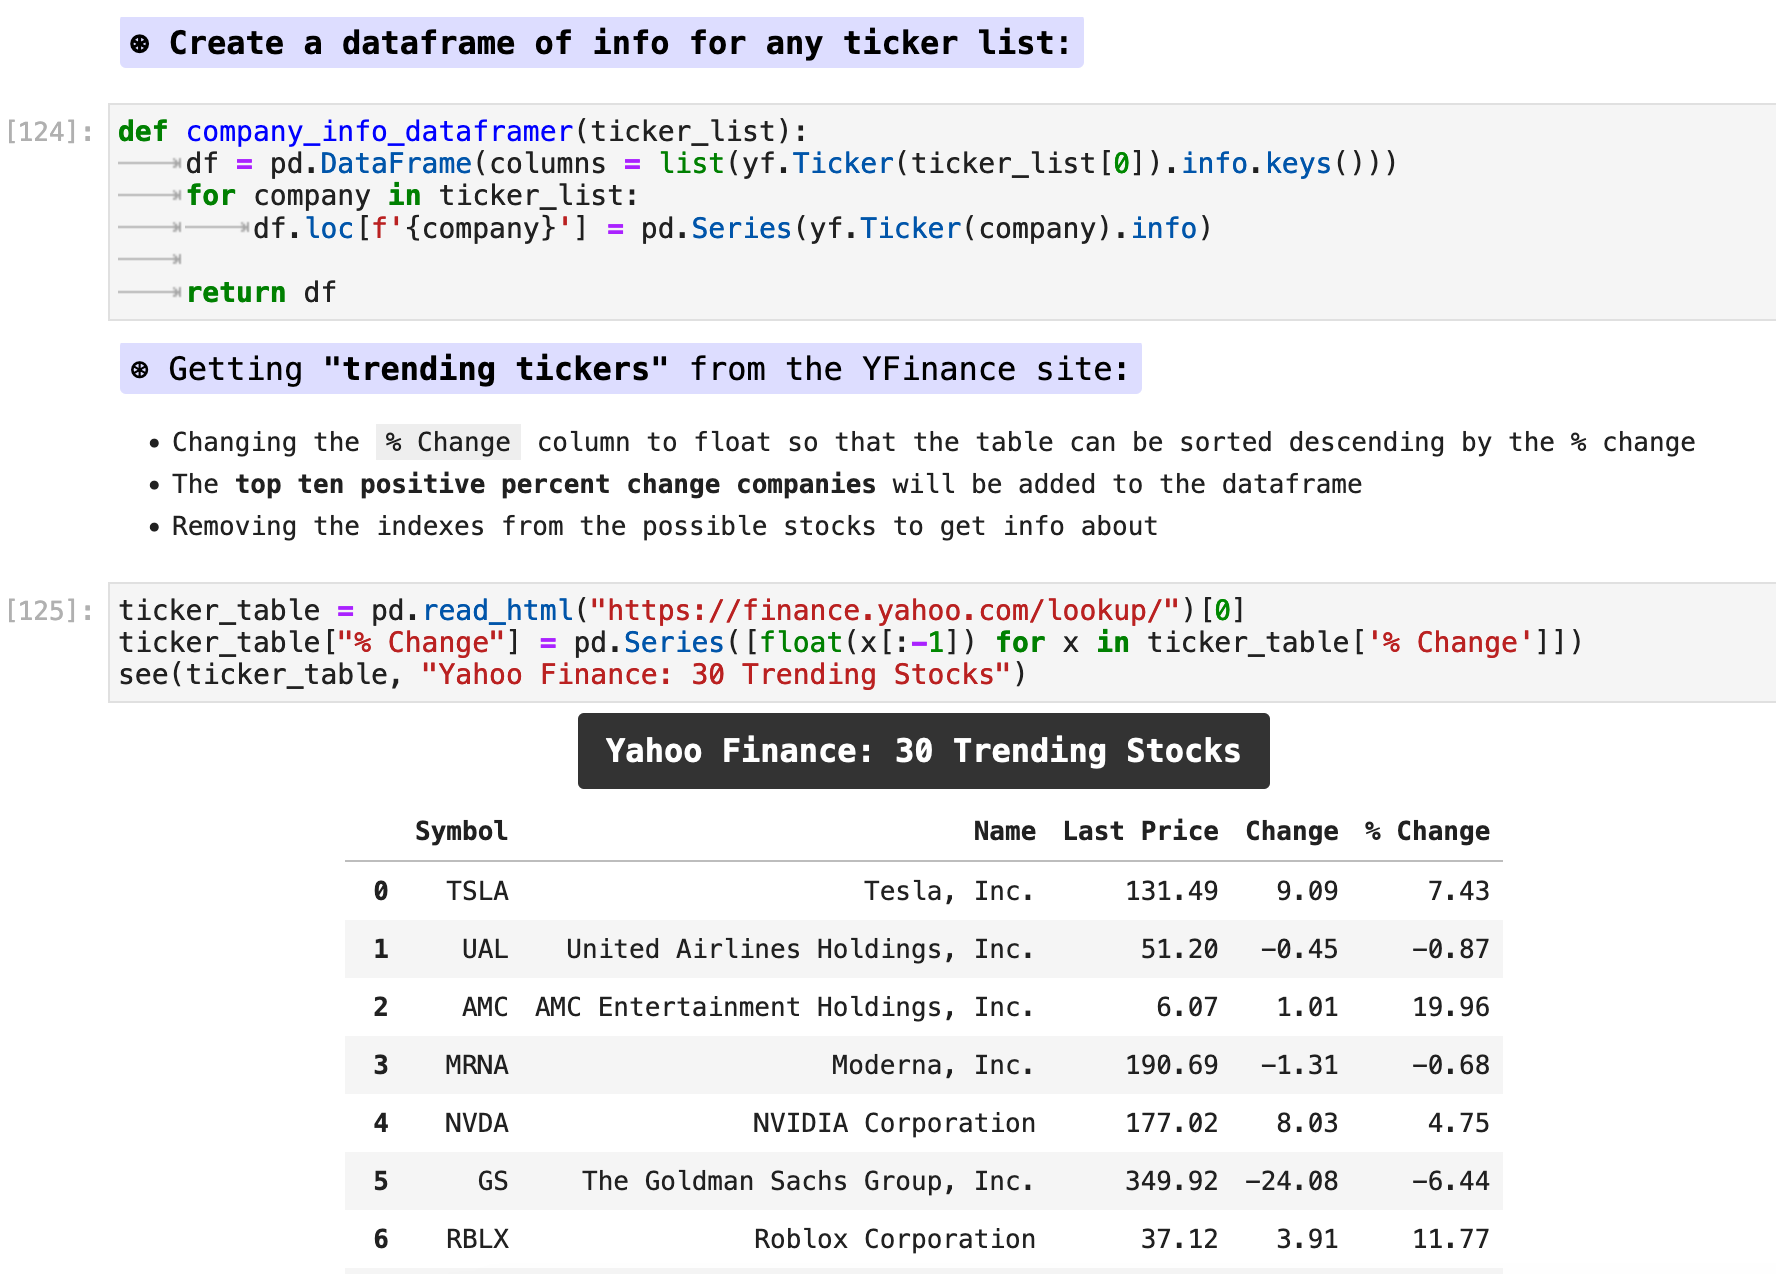
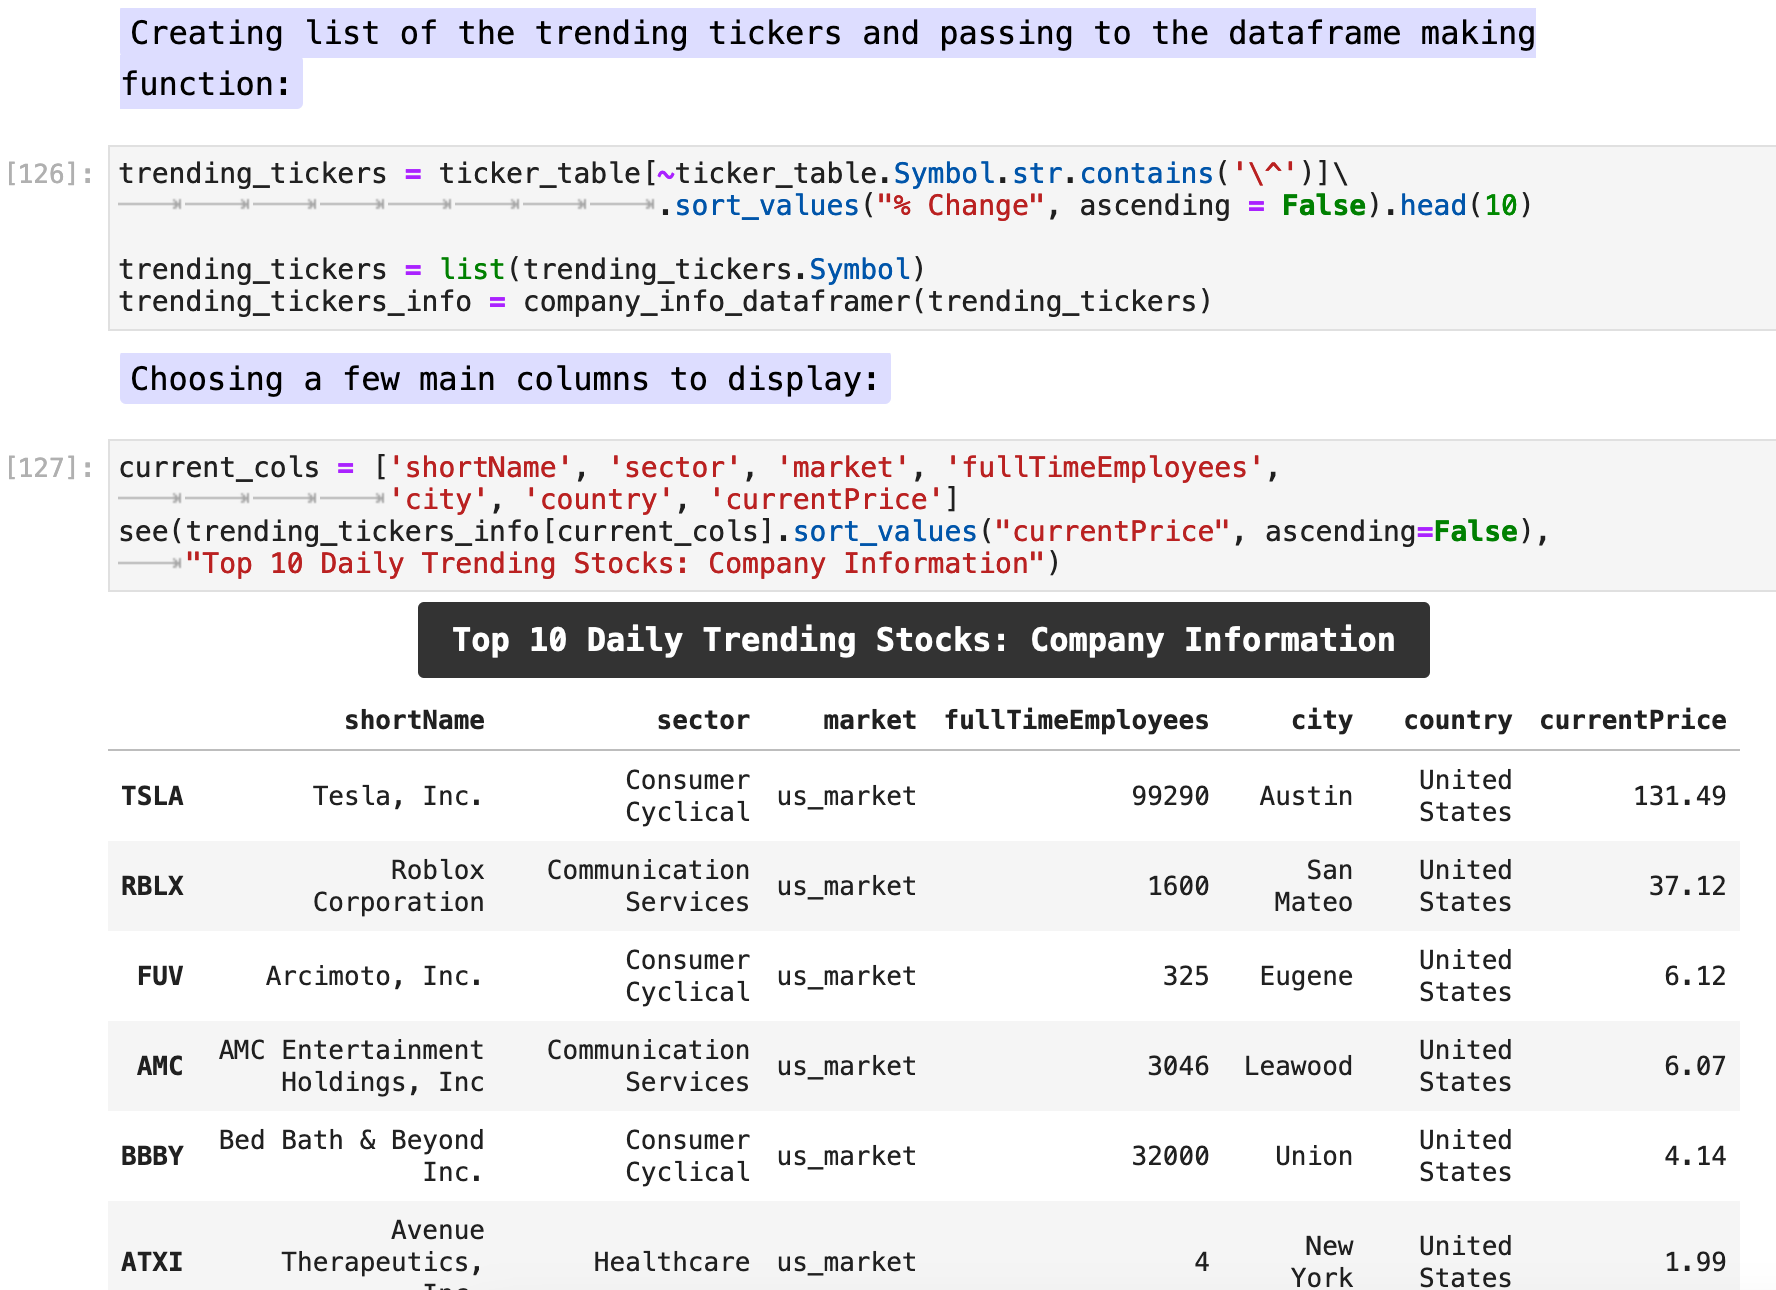
Now, I am able to take the top ten trending stocks, sorted by the highest percentage increase, and compile a dataframe of all 154 of the values for company data for each. Note that I have chosen to also be sure that any indexes that are trending are eliminated from this information by filtering out any ticker symbol that begins with ^ and use only individual company data. I have chosen to output only a few key columns of the data here, because the company summaries which appear in the first columns of data tend to take over the entire screen and are better viewed outside of a dataframe format.

Sections: ● Top ● Historical Data ● Setting Date Range ● High Frenquency ● Splits & Dividends ● Exporting ● Multiple Stocks ● Importing Indexes ● Currency Exchange ● Cryptocurrencies ● Mutual & Exchange Traded Funds ● Treasury Yields ● Ticker Object & Docs ● Stock Fundamentals ● Importing Financials ● Importing Put & Call Options ● Streaming Real-Time ●

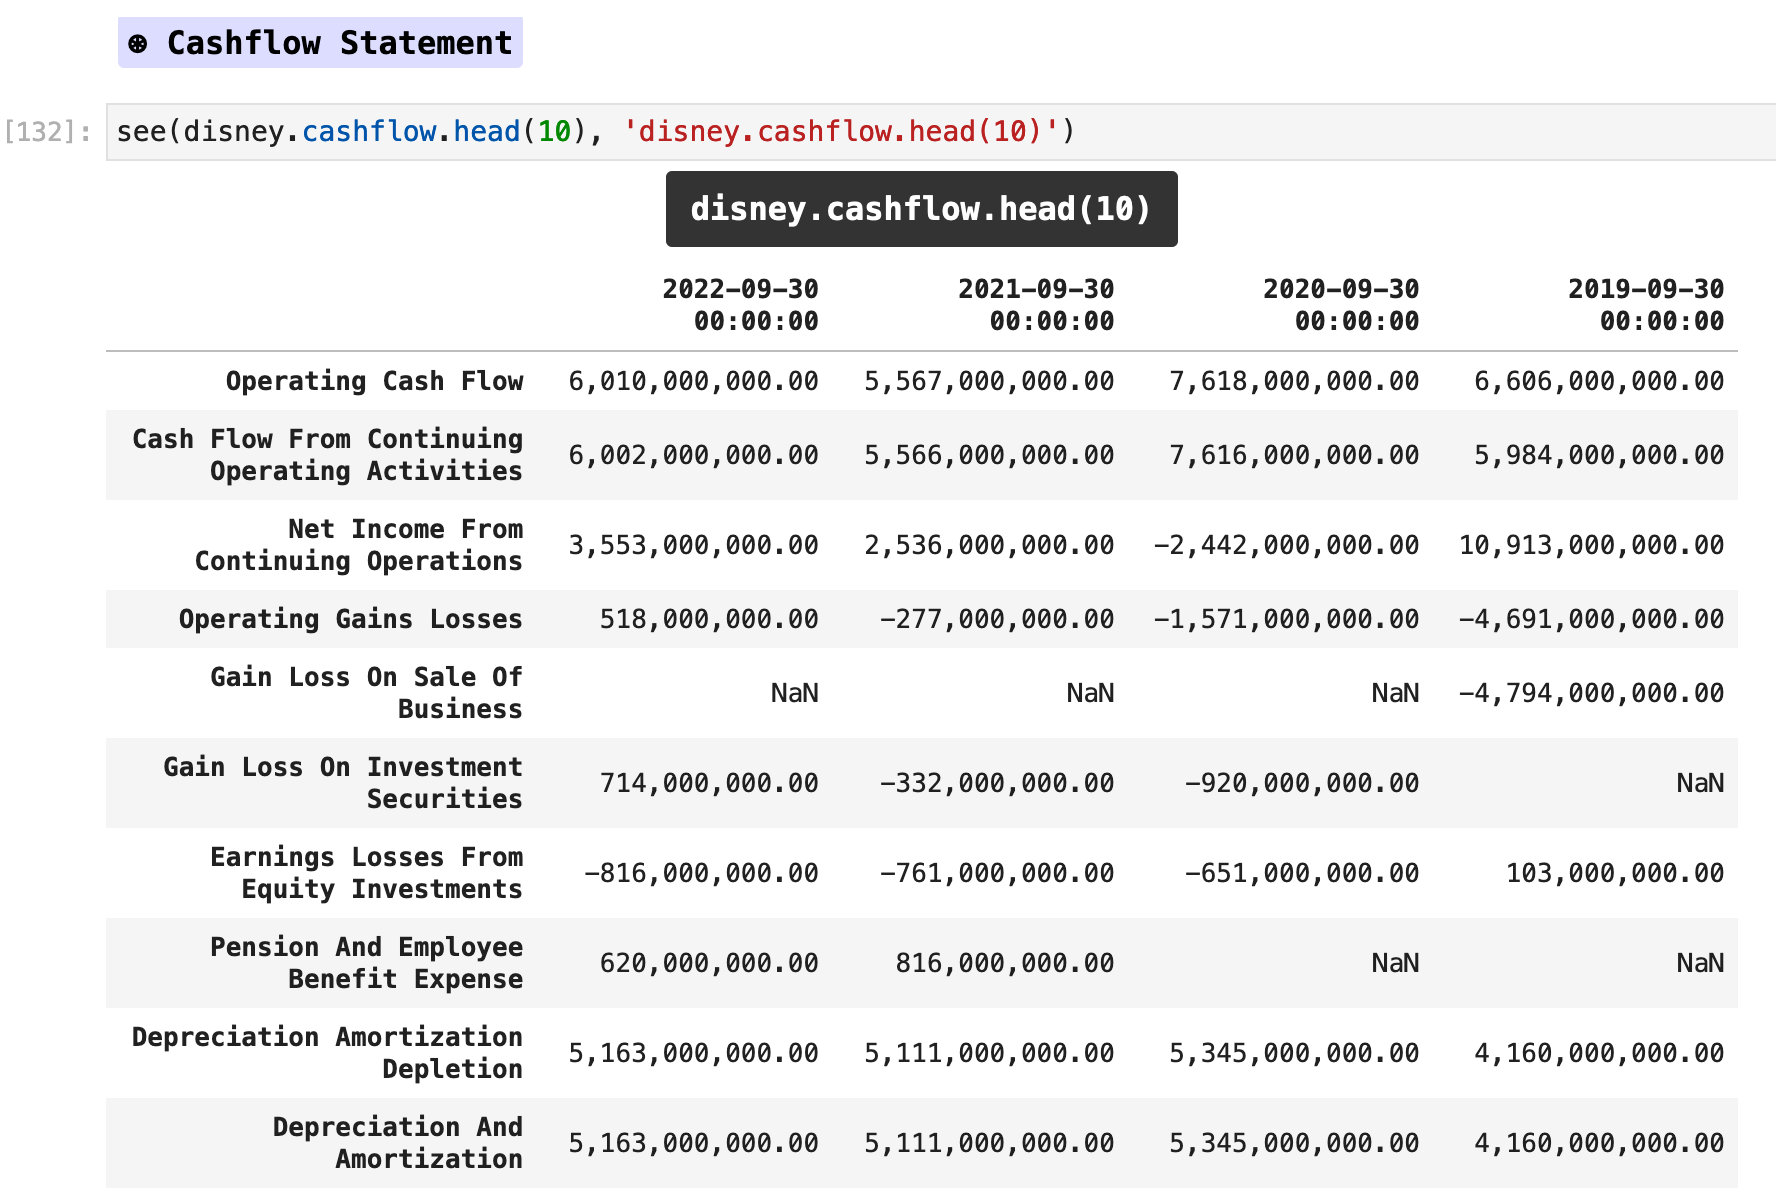
In addition to company information, users can also obtain financial data on companies including balance sheets, profit and loss statements, and cashflow statements. These are all attributes of the Ticker object in yfinance.

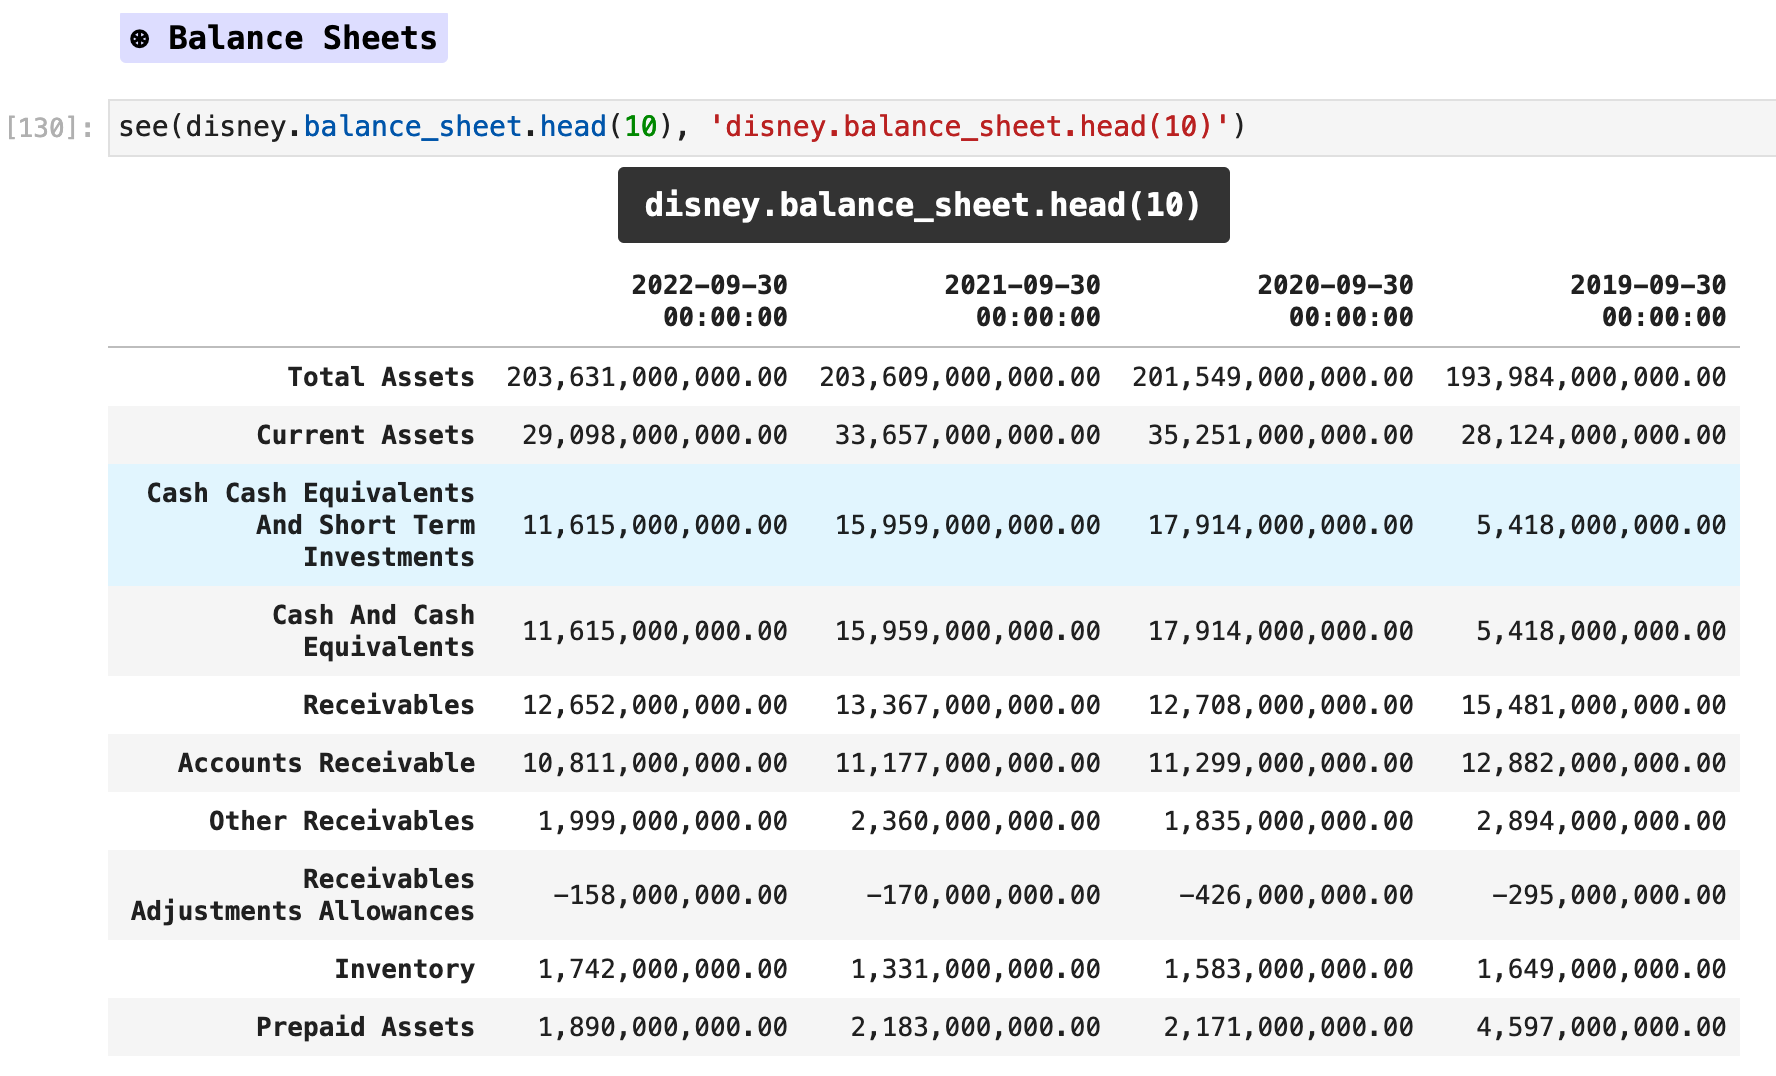
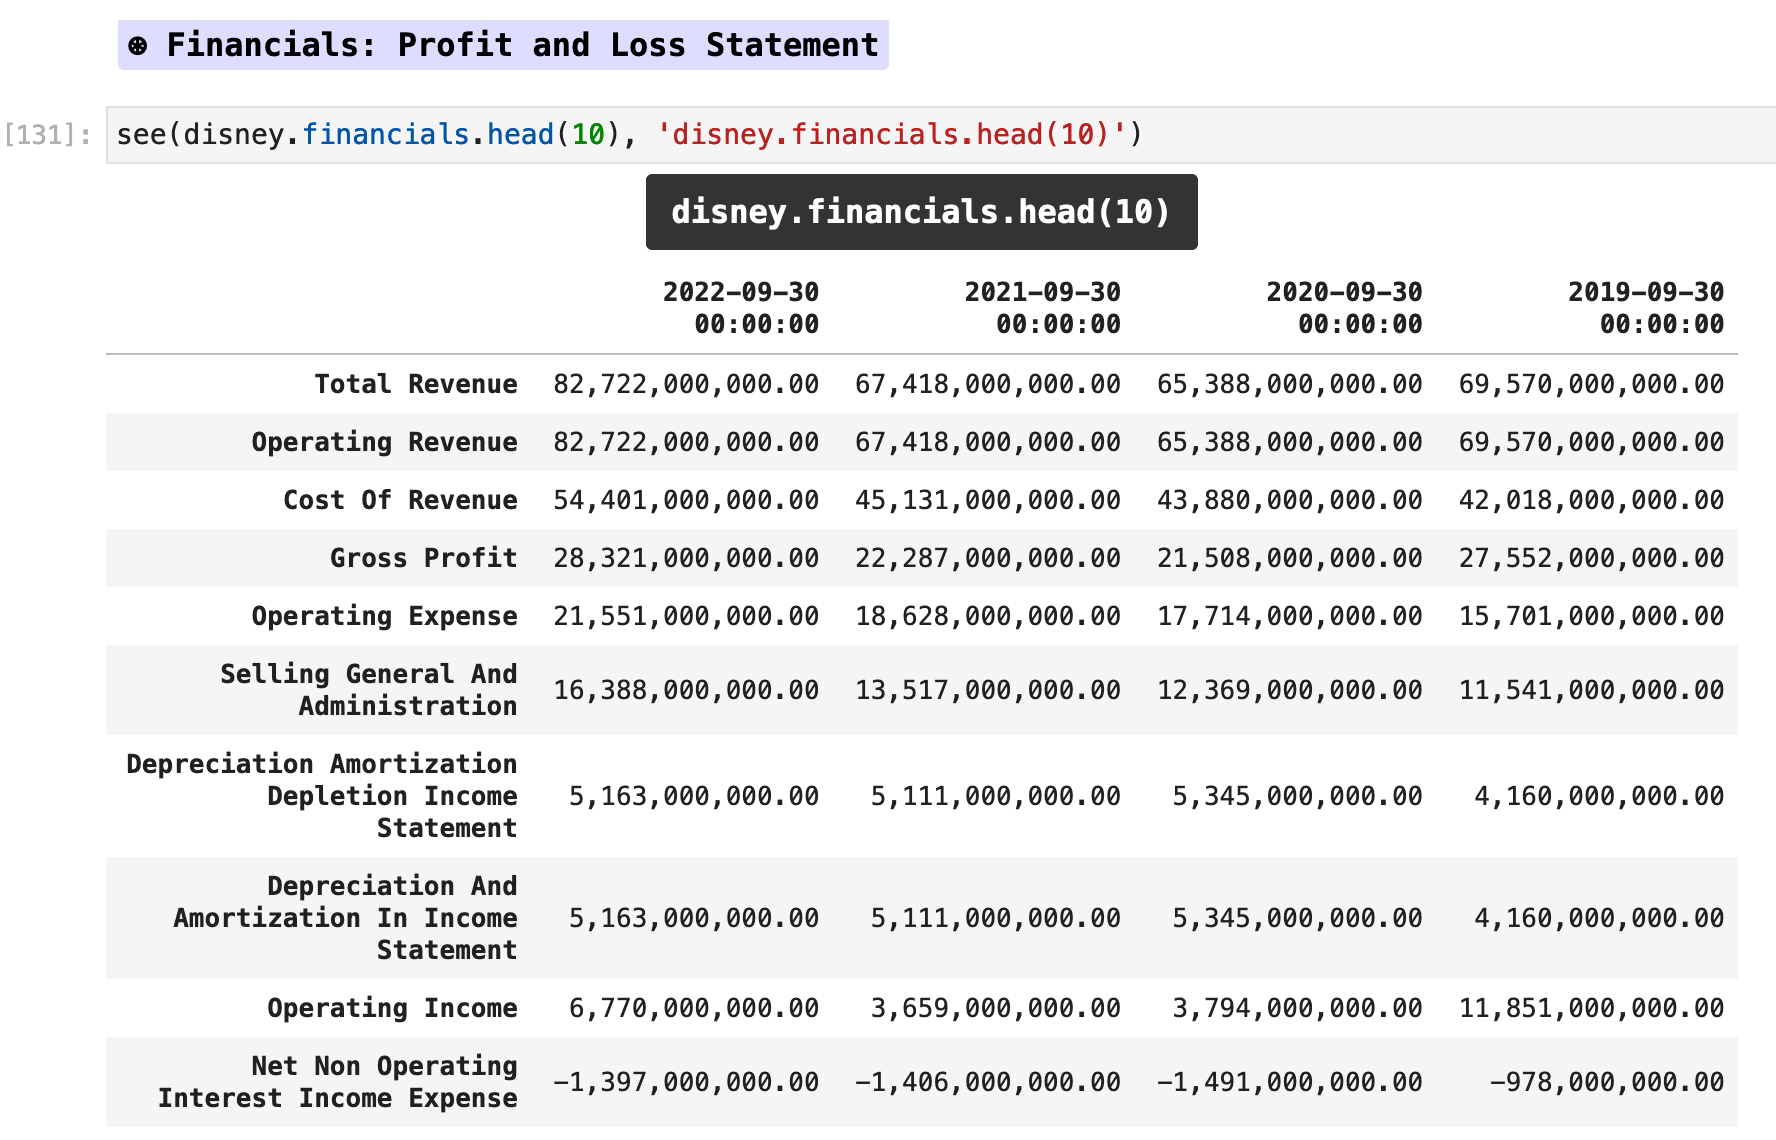
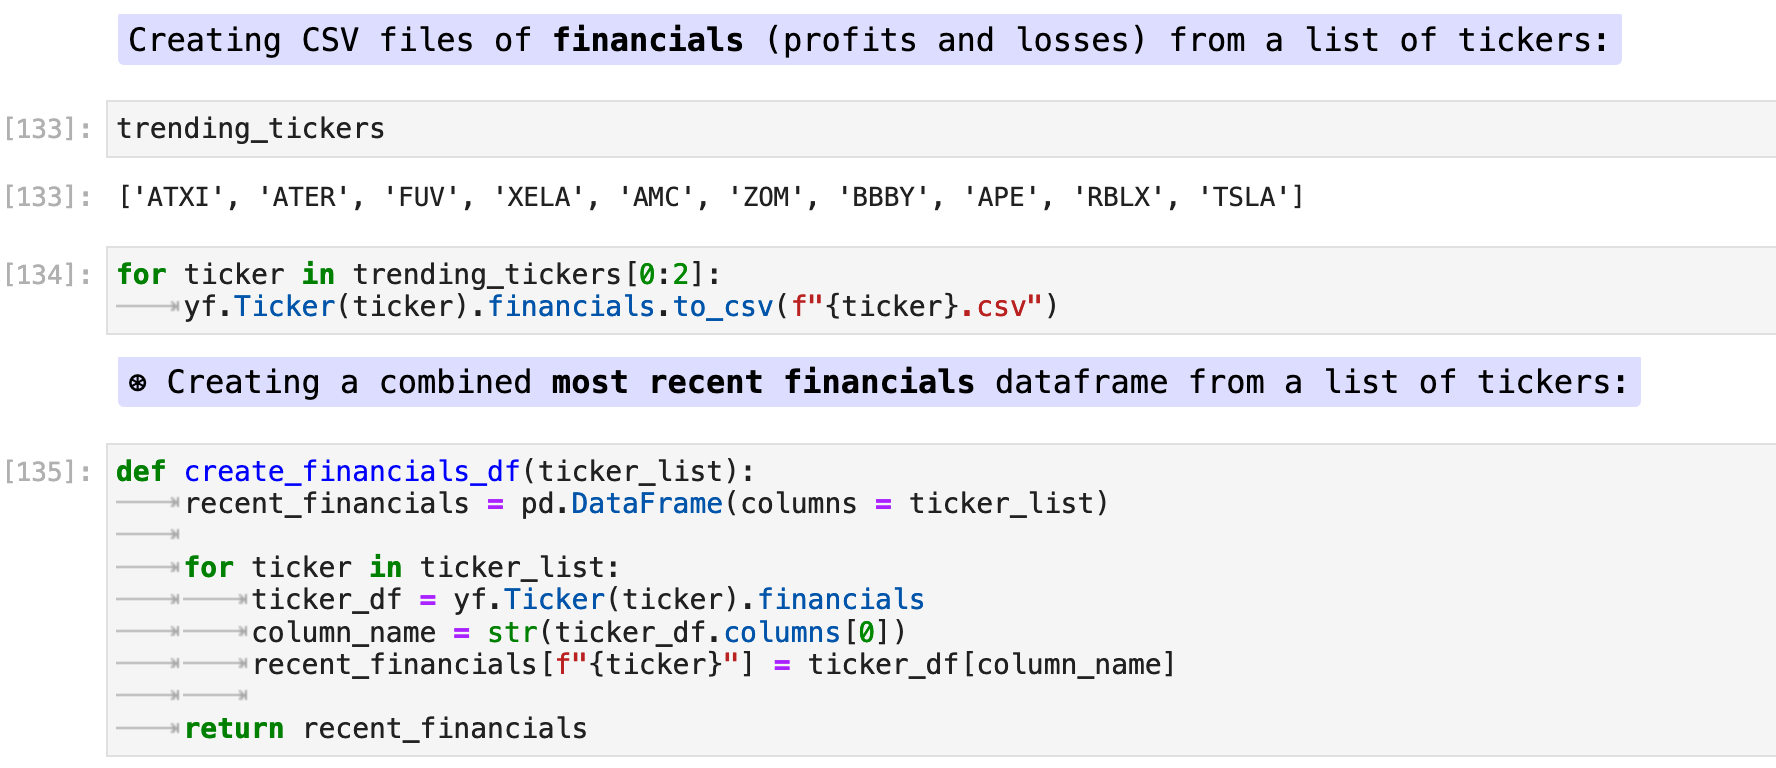
Here, I have created a function that compiles the Ticker.financials for a list of tickers and creates a dataframe of the combined information.
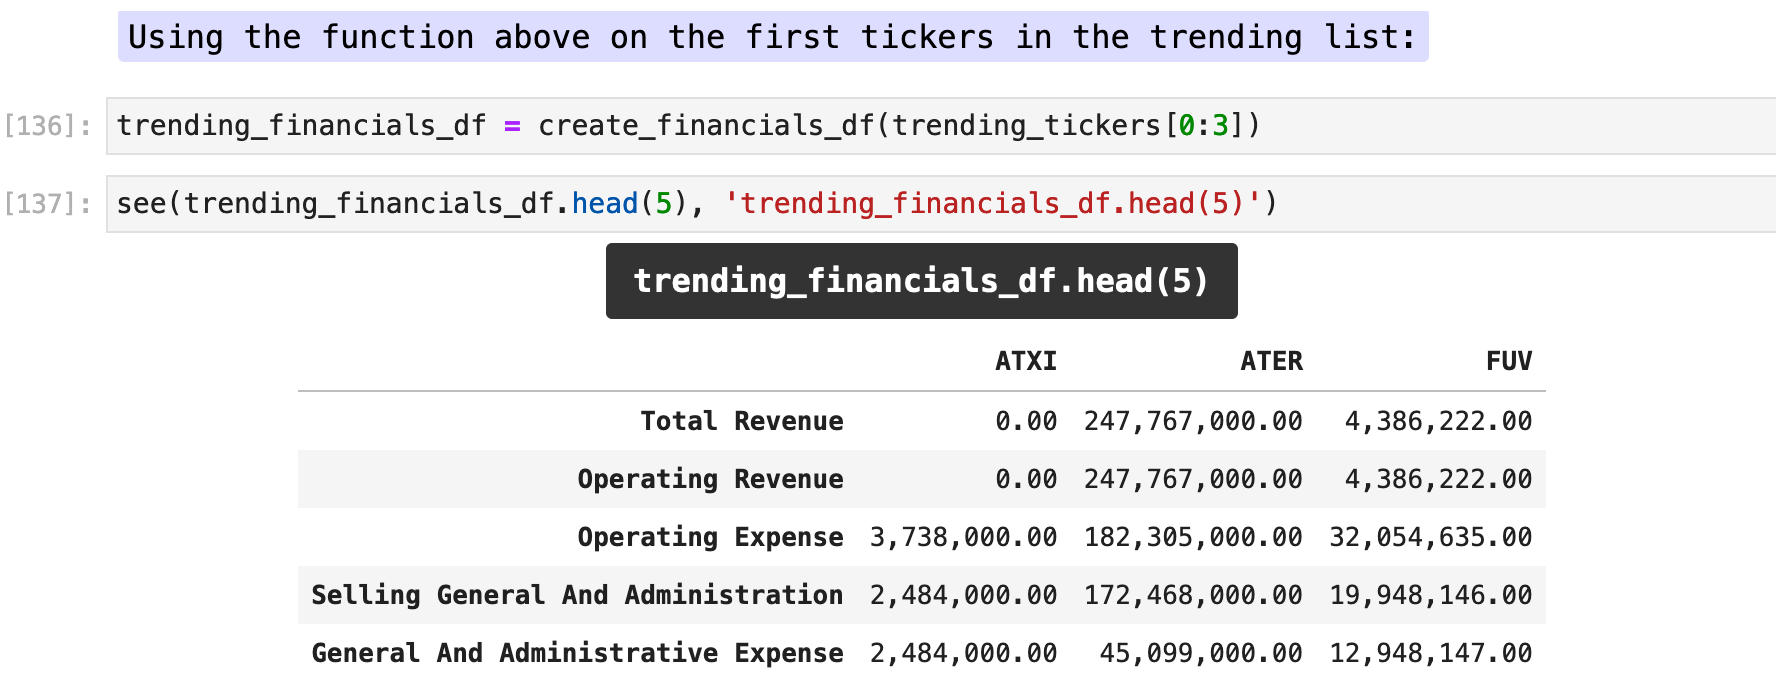
As you can see below, the function create_financials_df() returns a dataframe with columns for each of the ticker symbols passed and rows of data for each. This could also easily be transposed so that the companies are along the rows and the financials are the columns, depending on how the data will be utilized.

Sections: ● Top ● Historical Data ● Setting Date Range ● High Frenquency ● Splits & Dividends ● Exporting ● Multiple Stocks ● Importing Indexes ● Currency Exchange ● Cryptocurrencies ● Mutual & Exchange Traded Funds ● Treasury Yields ● Ticker Object & Docs ● Stock Fundamentals ● Importing Financials ● Importing Put & Call Options ● Streaming Real-Time ●

Put and call options are another example of data that is available through Yahoo Finance. The following is an explanation of put and call options from an article on JP Morgan Wealth Management.
A put option gives the buyer the right, but not the obligation, to sell an asset at a specified price (the strike price) before the option’s expiration date.
A call option gives the buyer the right, but not the obligation, to buy an asset at a specified price (the strike price) prior to its expiration date.
Buyers of put options make money on the difference between the strike price minus the premium the buyer must pay to buy the option and the lower price of the asset. The maximum loss is the premium paid to buy it.
Buyers of call options make money on the difference between the strike price plus the premium paid and however much the price of the asset has increased. The maximum loss is the premium paid to buy it.
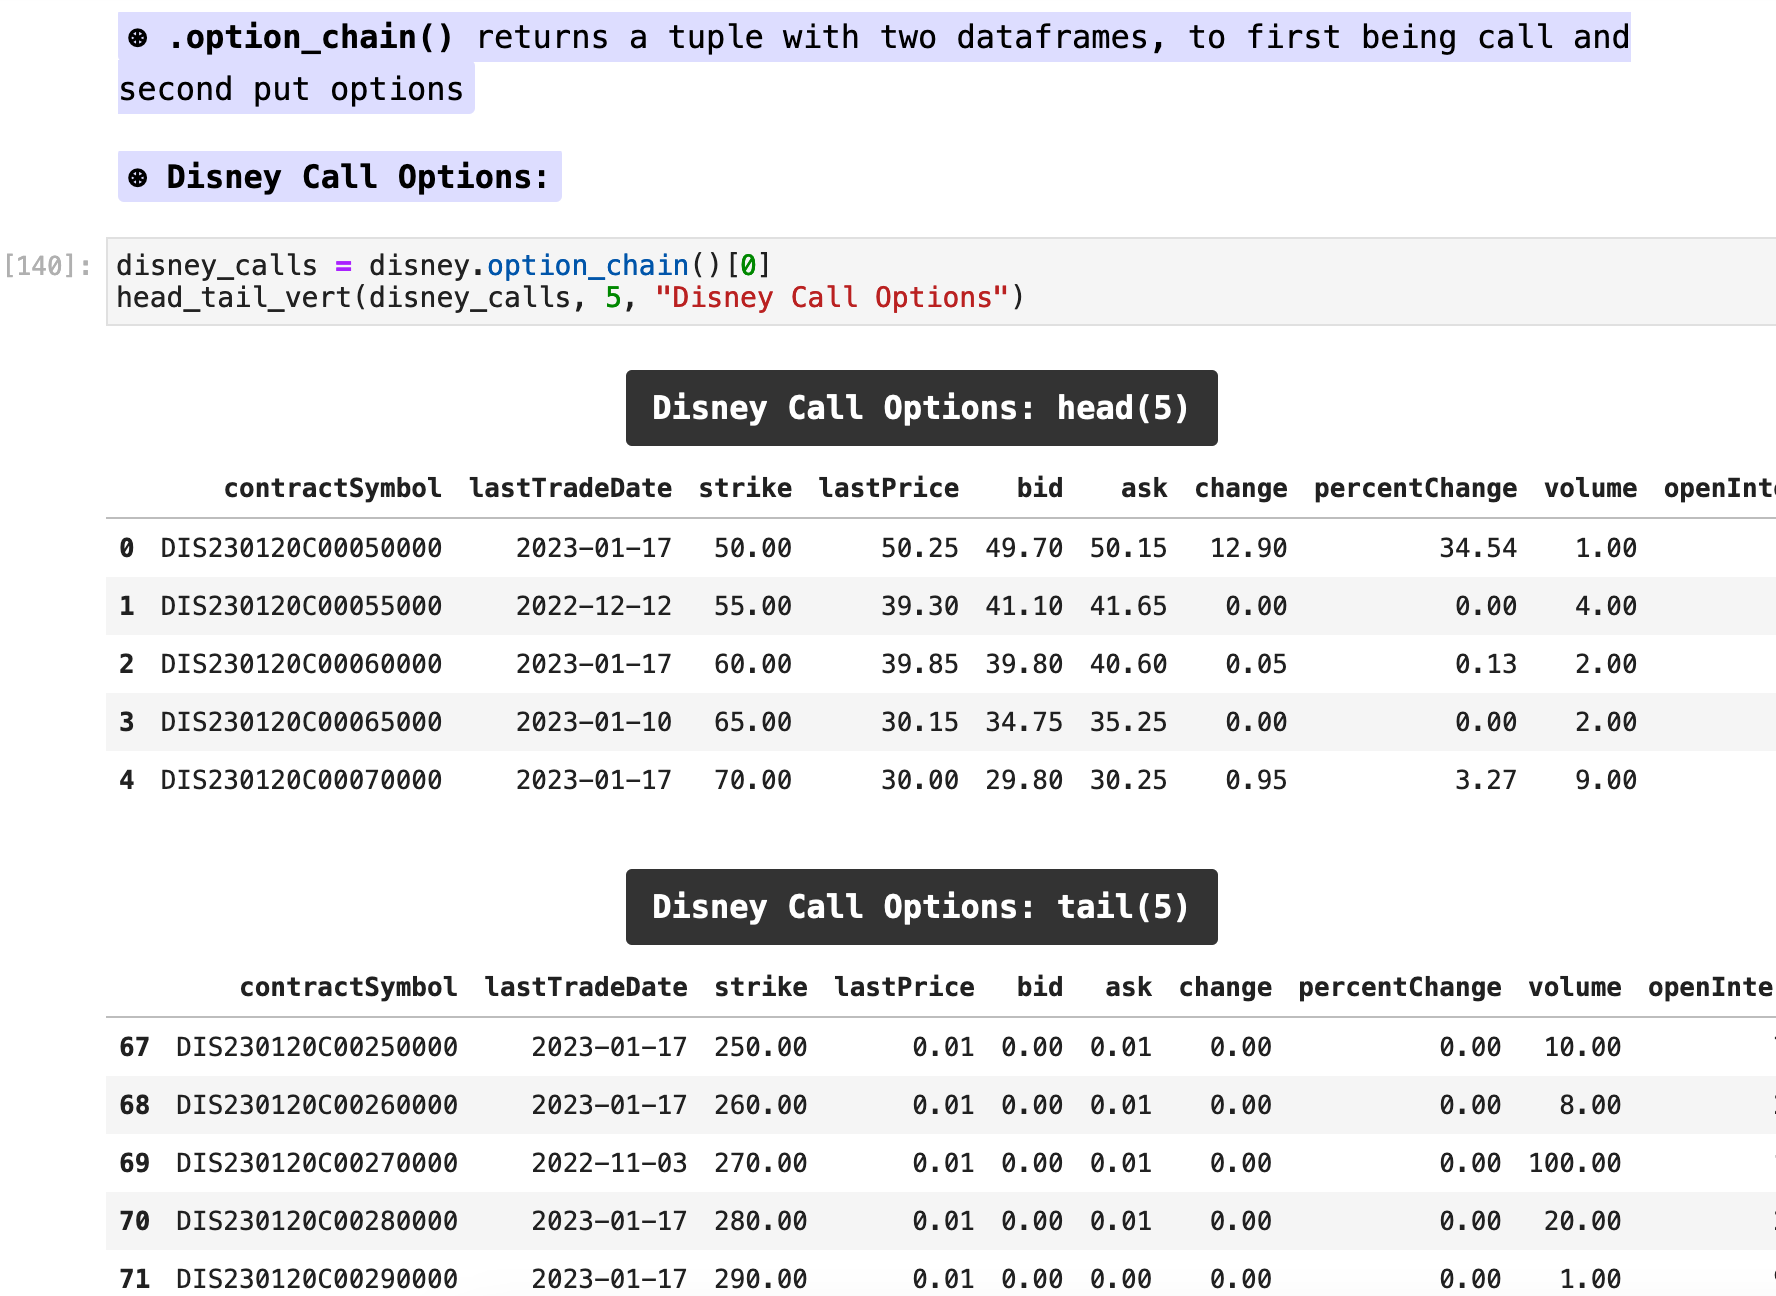
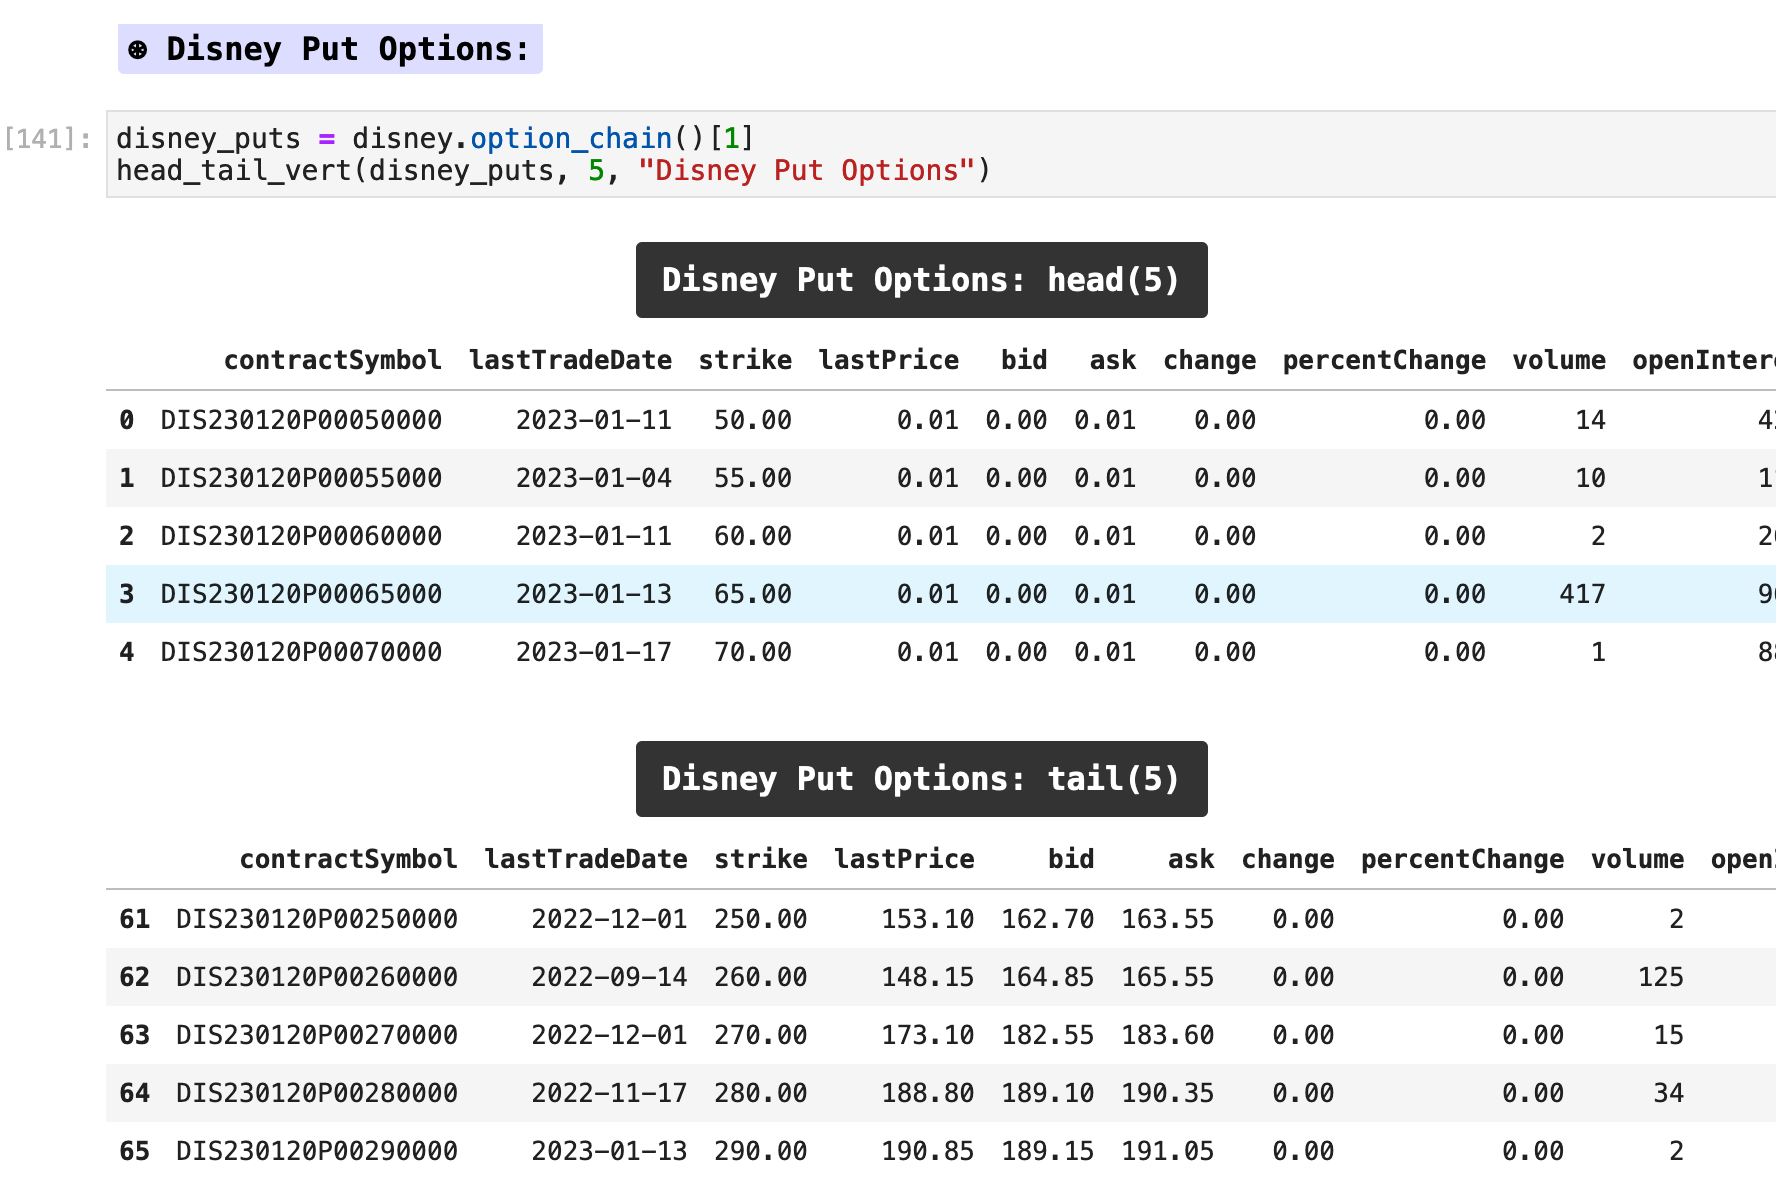
To retrieve this kind of data, we use the Ticker.option_chain() method from yfinance.


Sections: ● Top ● Historical Data ● Setting Date Range ● High Frenquency ● Splits & Dividends ● Exporting ● Multiple Stocks ● Importing Indexes ● Currency Exchange ● Cryptocurrencies ● Mutual & Exchange Traded Funds ● Treasury Yields ● Ticker Object & Docs ● Stock Fundamentals ● Importing Financials ● Importing Put & Call Options ● Streaming Real-Time ●

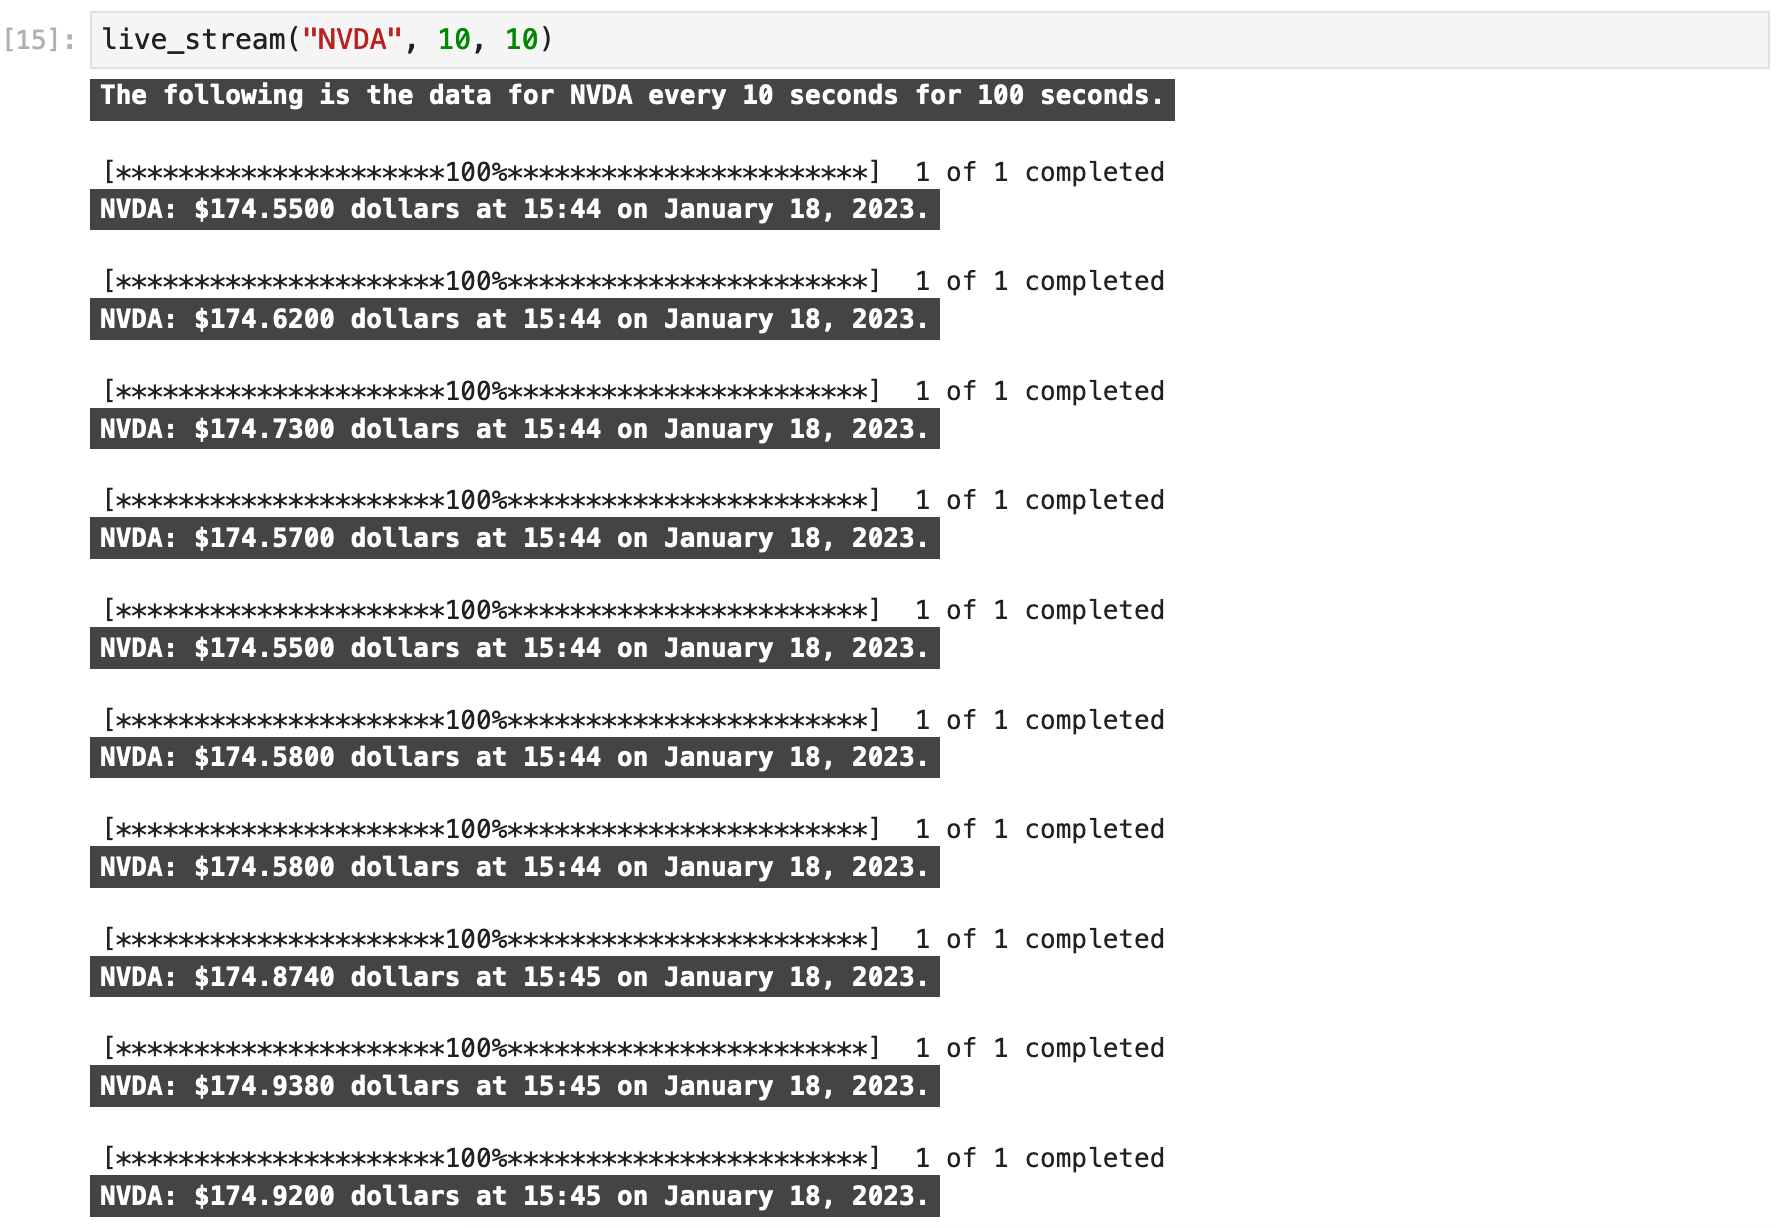
Until now, most of the data retrieval discussed has been more geared toward historical data, but what if you want to create a trading interface using Yahoo Finance and need real-time data? Here is a short example of how such a concept could be realized.
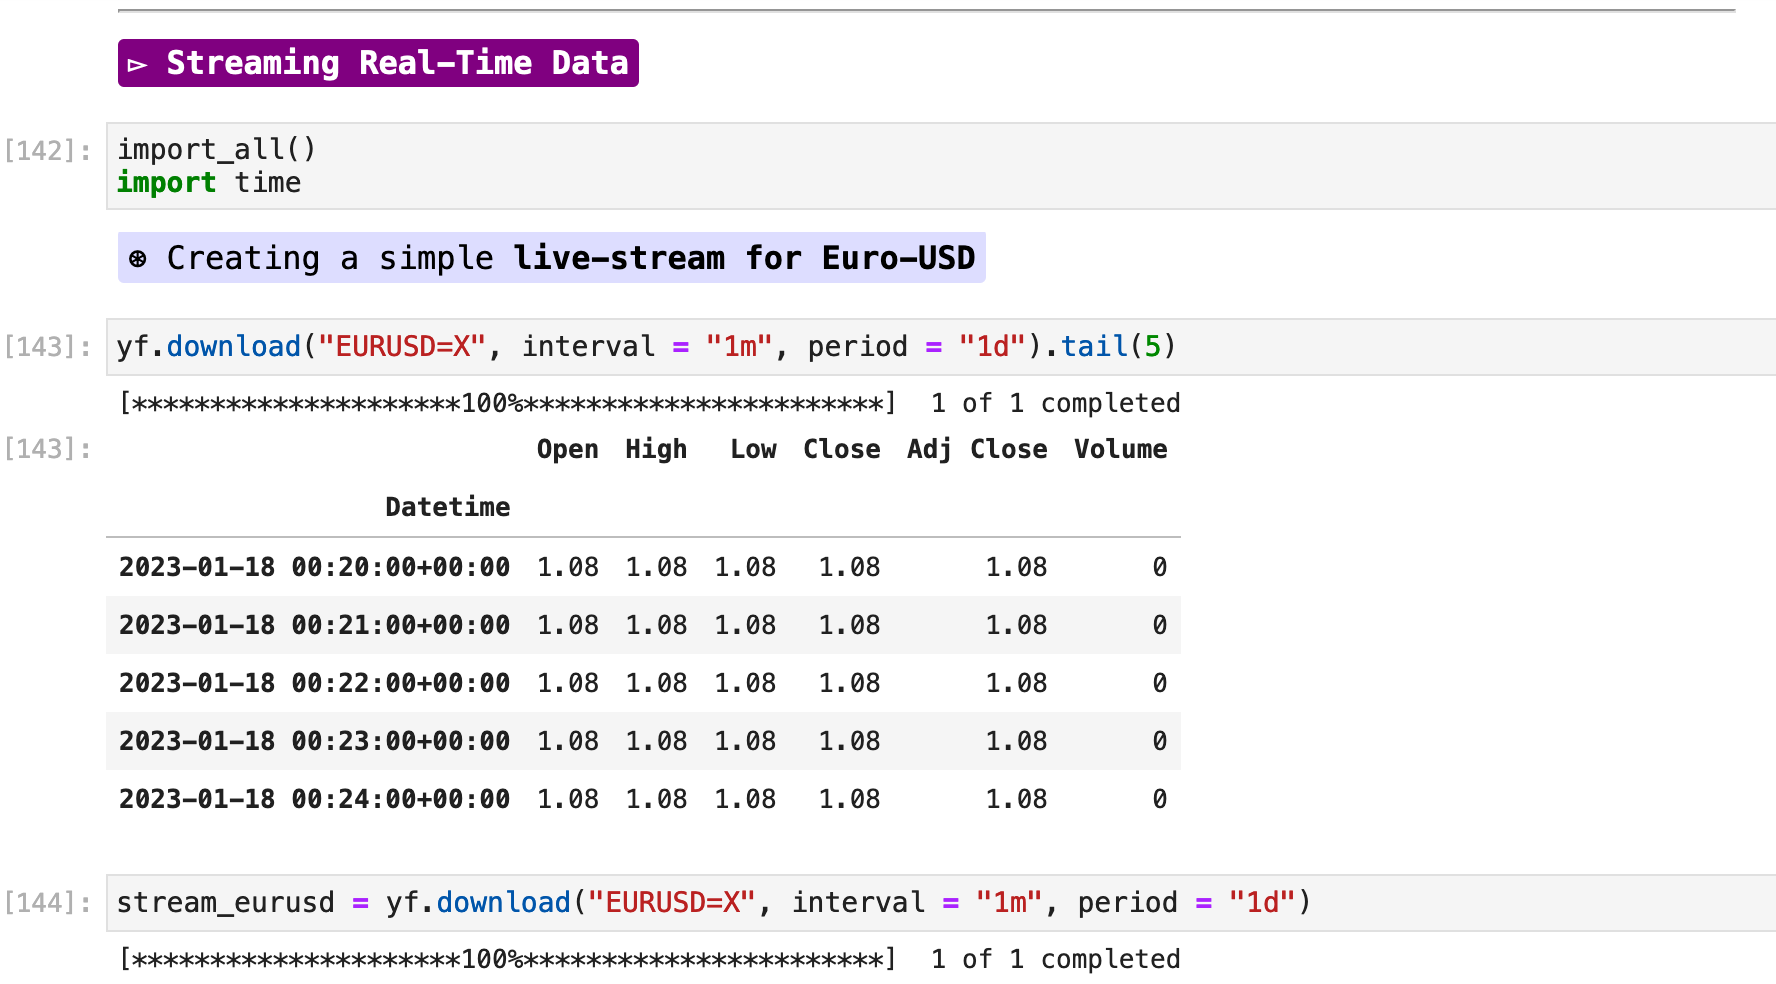
Creating a function to retrieve data on any stock at a given interval is easy, as seen below. This is a simple way to configure such a function, whereby a user can supply a ticker symbol, the interval in seconds for how often they want to be updated on prices, and how many updates they would like. There are a variety of ways this could be done, but this simple function is a quick introduction and offers a basic outline. It could also be customized to take a list of ticker symbols, etc.
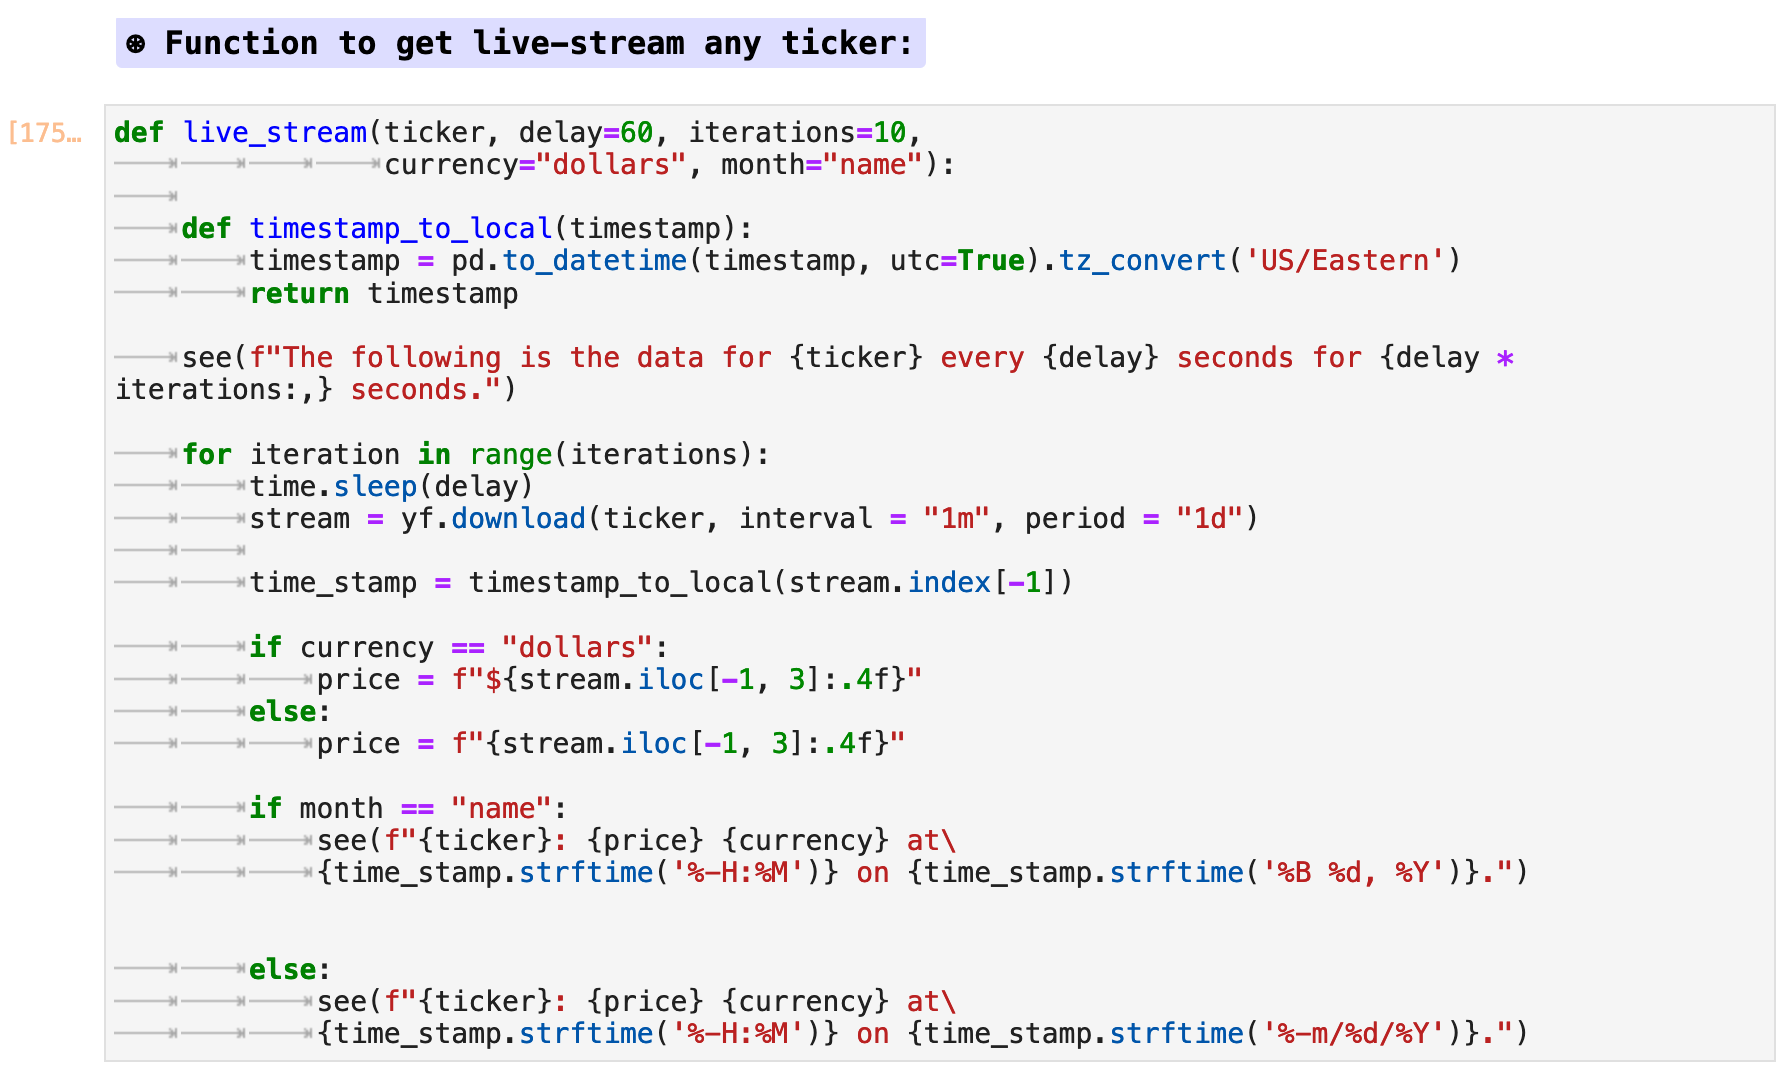
In the following example, I pass the ticker symbol for Nvidia and request an update every 10 seconds for 10 iterations. A while-loop is also an option to get continuous data in a similar way over a longer period of time.
