Source: Getting Started With Stock Market Data and Python | by Shivam Chauhan | Medium
Jul 29, 2020

Stocks data are available in real-time and Investors often use quantitative analysis for data processing, generating the trading signals, and for portfolio management.
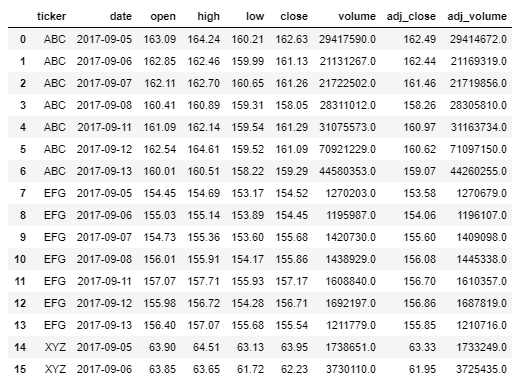
Several vendors provide stock data, however, often they are in a format that needs some data processing before using it for analysis. Here is an example of stock data that might look in pandas DataFrame.
5 pandas functions you can use for preprocessing stocks data.
pandas.DataFrame.pivot
Usually, to perform time-series functions, we need `date` column as our index.
import pandas as pd #importing pandas librarydf = pd.read_csv('stock_prices.csv') #loading the dataclose_prices = df.pivot(index=’date’, columns=’ticker’, values=’close’)
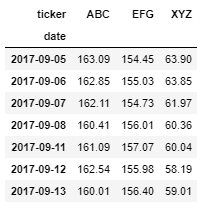
Similarly, you can use this function to create different datasets for the open price, high price, low price, the volume of trade, adjusted closing price, and adjusted volume.
2. pandas.DatetimeIndex
You can’t use other time-series functions if the index is not time-related. This also makes analysis very easy when want to use common abbreviations like [‘year’, ‘month’, ‘day’, ‘minute’, ‘second’, ‘ms’, ‘us’, ‘ns’]).
close_prices = pd.DatetimeIndex(close_prices.index)
close_prices.index

3. pandas.core.resample.Resampler.ohlc
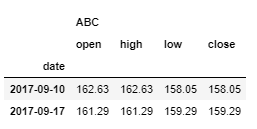
Investors are interested to know Open, High, Low, and Close prices of a stock. We can apply this resampler function to get Open, High, Low, and Close (OHLC) for the desired stock. Below we are calculating OHLC of ABC stock for each week.
ABC_close = pd.Series(close_prices.ABC)
ABC_close.index = pd.DatetimeIndex(ABC_close.index)
ABC_close.resample('W').ohlc()  #'W' is to get weekly data.
4. pandas.DataFrame.shift
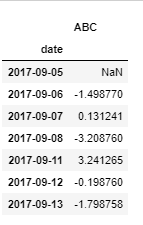
This function allows us to shift the rows of data. Investors look into the returns and log returns rather than just looking into the prices. To calculate the return you can use this function.
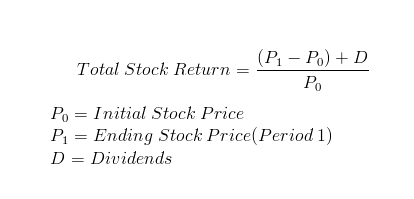
We have ending stock price data, so we can calculate the initial stock price:
D = 0.2 # dividend
returns = (ABC_close - ABC_close.shift(1))+ D / ABC_close.shift(1)
5. pandas.Series.nlargest
This function returns the largest n elements. This function can be used to get the top-performing stocks with the highest returns or closing price. Investors are interested to track these stocks so that they can add these stocks in their long portfolio(Buy at a lower price and sell at a higher price in the future).
#To make the 'XYZ' stock highest so that we can check our resultclose_prices.iloc[2,2] = 999#return number of times stock was higest value in the timeframe.close_prices.stack().nlargest(6).groupby(level=1).count().reindex(close_prices.columns,fill_value=0)

This function can also be used to find n smallest values.
reverse = close_prices * -1#return number of times stock was smallest value in the timeframe.reverse.stack().nlargest(7).groupby(level=1).count().reindex(reverse.columns,fill_value=0)

Final Thoughts
These were the 5 pandas functions I use for financial data processing. These functions can also be used for any time-related data to perform time series analysis. Specific roles where you can use these tools are Quantitative analyst, Quantitative researcher, Investment analyst, Data intelligence analyst, Risk analyst, Desk quant, Desk strategist, Financial engineer, Financial data scientist.
I hope that it’ll be useful for you as well!
Visit my website: https://chauhanshi.github.io/
Github: https://github.com/chauhanshi